Introducing Our New App Performance Score: A Smarter Way to Measure App Stability


Introducing Our New App Performance Score: A Smarter Way to Measure App Stability
Comfort, Consistency, and Confidence in Every Frame
At Cognitive3D, we know that the foundation of every great XR experience starts with a smooth, comfortable frame rate, one that feels natural and never breaks immersion. Delivering that kind of stability is essential to creating environments that feel real, responsive, and safe for users.
As part of this effort, we’ve upgraded our App Performance Score. The goal: to make it easier for developers to understand how their app truly feels in motion, not just how fast it runs.
This new score delivers consistent, clear feedback that reflects the real impact of performance issues, helping teams create high-quality, performant experiences across all use cases.
Why We Made These Changes
In earlier versions, performance was represented by a single number: a snapshot that didn’t fully capture the ups and downs of how an app performs in real time. But XR is dynamic. A momentary stutter, a drop in frame rate, or an unstable scene can pull users out of the experience. Or worse, it could make them uncomfortable.
We wanted to change that.
The new App Performance Score moves beyond a static average to a comprehensive, multi-dimensional score that accounts for how significant and how often performance dips occur. It provides a fairer, clearer picture; one that tells developers not just what’s happening, but how much it matters.
Our goal was simple: to help teams deliver comfortable, performant environments, regardless of use case or device.
What’s New in the App Performance Score
The upgraded model integrates a more sophisticated approach to analyzing frame rate and frame timing stability. We evaluate performance by capturing moment-to-moment trends, in addition to looking at patterns over time, identifying moments of strain or drop-offs that affect comfort and immersion.
Key enhancements include:
- Frame Stability Index – A new component that measures the variance of frame timing, revealing how smooth the experience feels in motion.
- Weighted Consistency Model – Fluctuations and outliers are taken into consideration, so short bursts of instability now have visible impact on the score.
- Granular Temporal Analysis – Developers can now identify exactly when and where instability occurs, making it easier to pinpoint and resolve bottlenecks.
The result: a single, consolidated App Performance Score that communicates both speed and stability, the true pillars of immersive app performance.
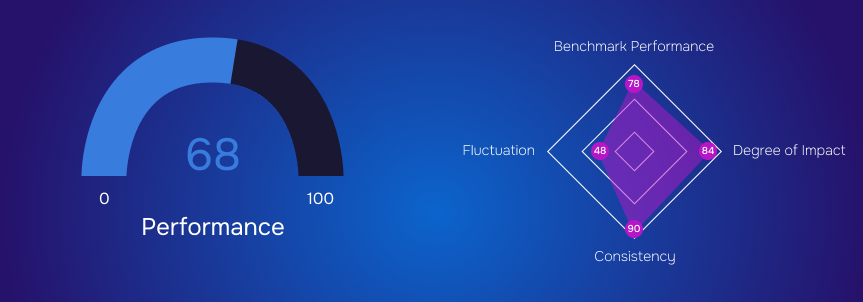
The Four Core Components of Performance
To make the score more transparent and meaningful, it’s now broken into four key components, each offering insight into a different aspect of performance quality.
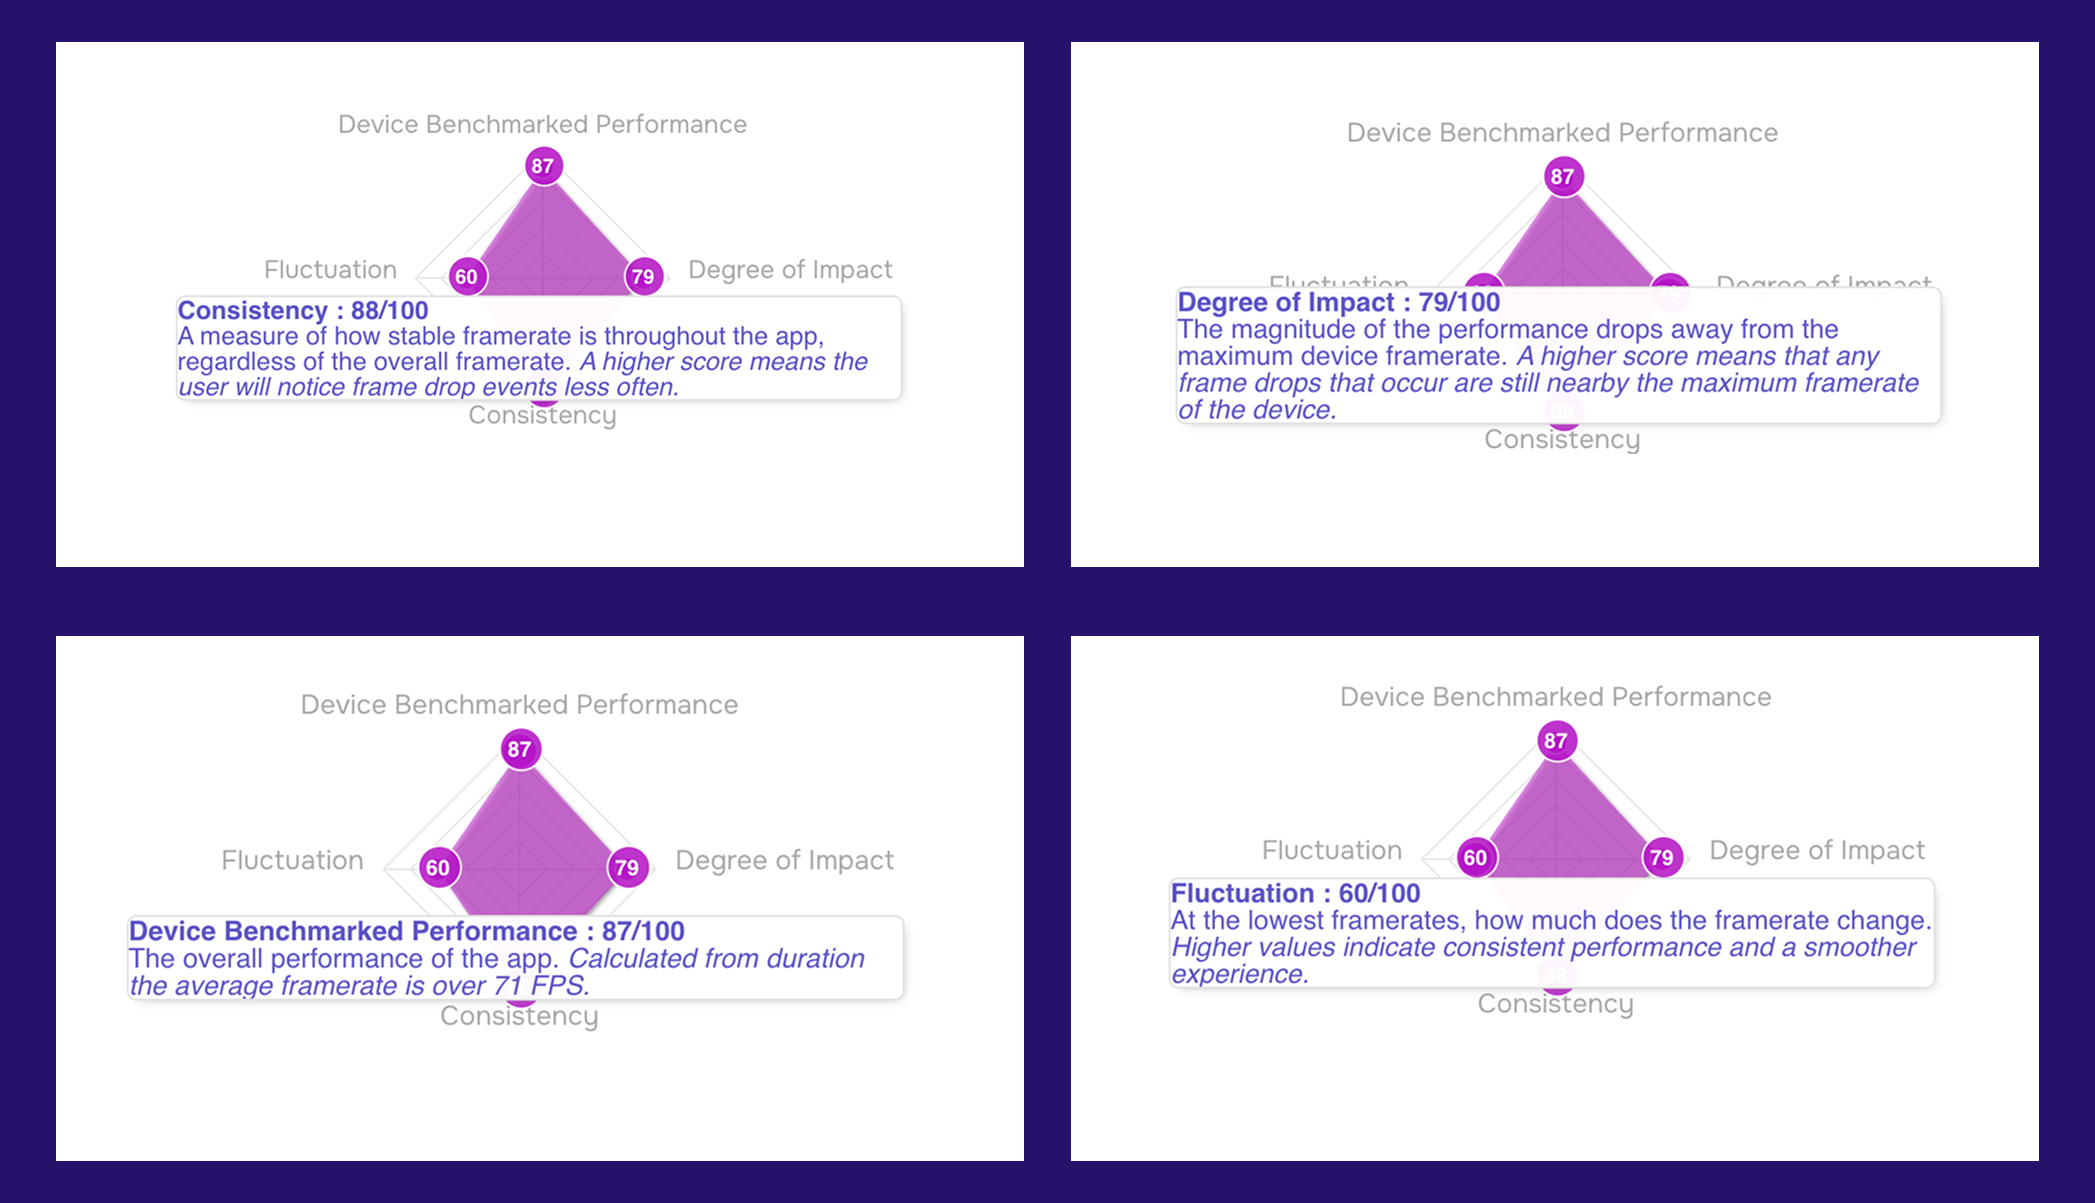
1. Device Benchmarked Performance
This measures the overall capability of the app on a given device, showing how well it performs compared to expected app standards.
A high score means the app maintains a strong frame rate, ensuring a fluid and realistic experience.
A lower score shows that FPS is not occurring at the rate expected by the creators of the chosen device.
This helps teams confirm their content runs as intended across hardware types.
2. Degree of Impact
Not all frame drops are equal. This score represents how far performance dips away from the device’s maximum frame rate.
A higher score indicates that any frame drops are minor and users may not even notice them, meaning the app remains smooth and comfortable even when performance fluctuates.
A lower score indicates the performance dips may be more often or for longer periods of time, negatively affecting user experience.
3. Consistency
Consistency measures how stable the frame rate is throughout an experience, regardless of the overall average.
When this score is high, users will experience fewer noticeable frame drops, keeping the experience steady and predictable.
The inability of the app to deliver a consistent expected FPS throughout the entire experience may cause a lower score.
It’s one of the most important indicators of comfort, because steadiness feels natural.
4. Fluctuation
This metric looks at how much the frame rate changes at its lowest points.
A higher fluctuation score means the frame rate remains smooth, even when performance is challenged.
A lower fluctuation score means the app’s performance is unpredictable under load. It may lag and have inconsistent timing between frames.
It’s an indicator of resilience: how well your app handles demanding moments without visible strain or stutter.
Together, these four components create a complete picture of how performance feels to the end user, not just technically, but experientially.
Why It’s Better
This new system brings meaning and context to performance data. It’s no longer about chasing a single perfect number, it’s about understanding the quality and consistency of the experience.
Developers now get:
- A clearer reflection of app performance stability in every session.
- Consistent data feedback that tracks meaningful changes over time.
- Actionable insight to guide optimization and design decisions.
Ultimately, it empowers teams to deliver experiences that feel effortless. The technology powering the experience takes a backseat, and users can focus on what truly matters: presence, immersion, and usability.
Building the Future of Performance Insight
This update is the first step in a broader evolution of how Cognitive3D measures immersive quality. By redefining what “performance” means, from raw speed to experiential comfort, we’re helping developers create apps that perform beautifully, no matter the platform or purpose.
The App Performance Score sets the foundation for a more holistic scoring system to come; one that blends movement, ergonomics, and interaction to form a complete picture of user experience.
Because in the end, great performance isn’t just about numbers. It’s about how real your virtual world feels, and how comfortably users can stay there.