View Top-Level Metrics: The Dashboard That Makes XR Performance Make Sense


View Top-Level Metrics: The Dashboard That Makes XR Performance Make Sense
The Need for Immediate Visibility in XR
You can’t guide what you can’t see, and in XR, that fact becomes even more pressing. Immersive content unfolds in real time; inside 3D environments, through complex patterns of attention, movement, and interaction. When teams don’t have an instant view into what’s happening inside those experiences, they’re left navigating in the dark.
Every immersive project begins with intention and creativity. Developers design scenes, trainers define learning objectives, product owners set strategic goals. But without clear visibility into real usage and behavior, even the strongest teams struggle to validate whether their decisions are working. Debates replace data, and confidence erodes.
Top-level metrics exist to counter this. They give XR teams an immediate pulse check: a way to open the platform and instantly understand the health of their experience. No guesswork. No digging. Just clarity from the very first glance.
The Risks of Operating Without XR Performance Visibility
When the foundational health of an XR experience isn’t visible, issues quietly accumulate beneath the surface. Teams lose sight of how often the experience is being used, whether participants are staying long enough to complete tasks, or whether session activity is rising, stabilizing, or fading.
Over time, this lack of visibility creates cascading consequences. Designers make updates without understanding their impact. Stakeholders question whether the investment is worthwhile. Analysts spend hours stitching data together manually, pulled from logs, exports, or spreadsheets that don’t reflect the full picture.
Even small uncertainties slow momentum. Teams hesitate to make decisions, unsure whether changes improve or harm the experience. Opportunities for refinement go unnoticed. Friction points persist longer than they should. And as uncertainty grows, trust in the data diminishes.
The real cost of unseen XR performance isn’t just wasted time, it’s the erosion of progress.
Why Cognitive3D Built Instant - Insight Dashboards
Tony Bevilacqua, CEO of Cognitive3D, often emphasizes a core philosophy:
“Teams shouldn’t have to hunt for truth, it should greet them the moment they log in.”
That belief shaped the design process behind Cognitive3D’s top-level dashboards.
Rather than requiring teams to write complex queries or dig into multiple analytics tools, top-level metrics offer a unified, immediate perspective. The experience is intentionally simple. Anyone- designers, instructors, product leads, executives- can access the dashboard and instantly understand what’s happening.
This approach prioritizes alignment. When everyone sees the same high-level insights at the same moment, conversations shift from interpretation to action. The dashboard isn’t just a tool for data; it becomes a foundation for collaboration and decision-making.
How Top-Level Metrics Reveal the Pulse of Your Experience
In XR analytics, dashboards do more than summarize behaviour, they reveal the heartbeat of the experience. Because immersive environments generate continuous streams of behavioural, spatial, and temporal data, traditional reporting often fails to capture the dynamic nature of user interaction.
Top-level metrics translate this complexity into a readable pulse. They highlight surges in activity, dips in session length, spikes in engagement, and shifts in usage patterns. They expose how different versions of the application compare. They reveal whether the experience is gaining traction or plateauing.
This transformation changes how teams interact with data. Instead of treating analytics as a retrospective task, teams begin monitoring trends in motion. Problems surface before they escalate. Improvements become visible sooner. The dashboard becomes a living indicator of success, one that evolves as the experience evolves.
What Large-Scale XR Data Tells Us About Visibility
When organizations begin looking at their XR activity at scale, a consistent pattern emerges: visibility changes everything. Teams who regularly review their top-level metrics tend to identify issues earlier, respond to trends more confidently, and refine their experiences with far greater precision.
One of the most common insights that surfaces in broad analytics is how much activity and behaviour teams were unaware of prior to having a unified dashboard. Patterns like session drop-offs, version disparities, or shifts in user engagement often become immediately apparent once teams can see their data in one place. These are the kinds of trends that are difficult to detect manually, yet become unmistakable when displayed visually.
Long-term observation also reveals that teams who maintain steady visibility into their metrics tend to navigate improvements more effectively. They iterate with clearer intent, recognize the impact of design or training updates sooner, and make decisions rooted in real usage rather than assumptions.
The takeaway is simple: when teams have a clear window into what’s happening inside their XR experiences, their ability to improve, optimize, and communicate results strengthens significantly.
How Cognitive3D Brings Clarity to Complex XR Data
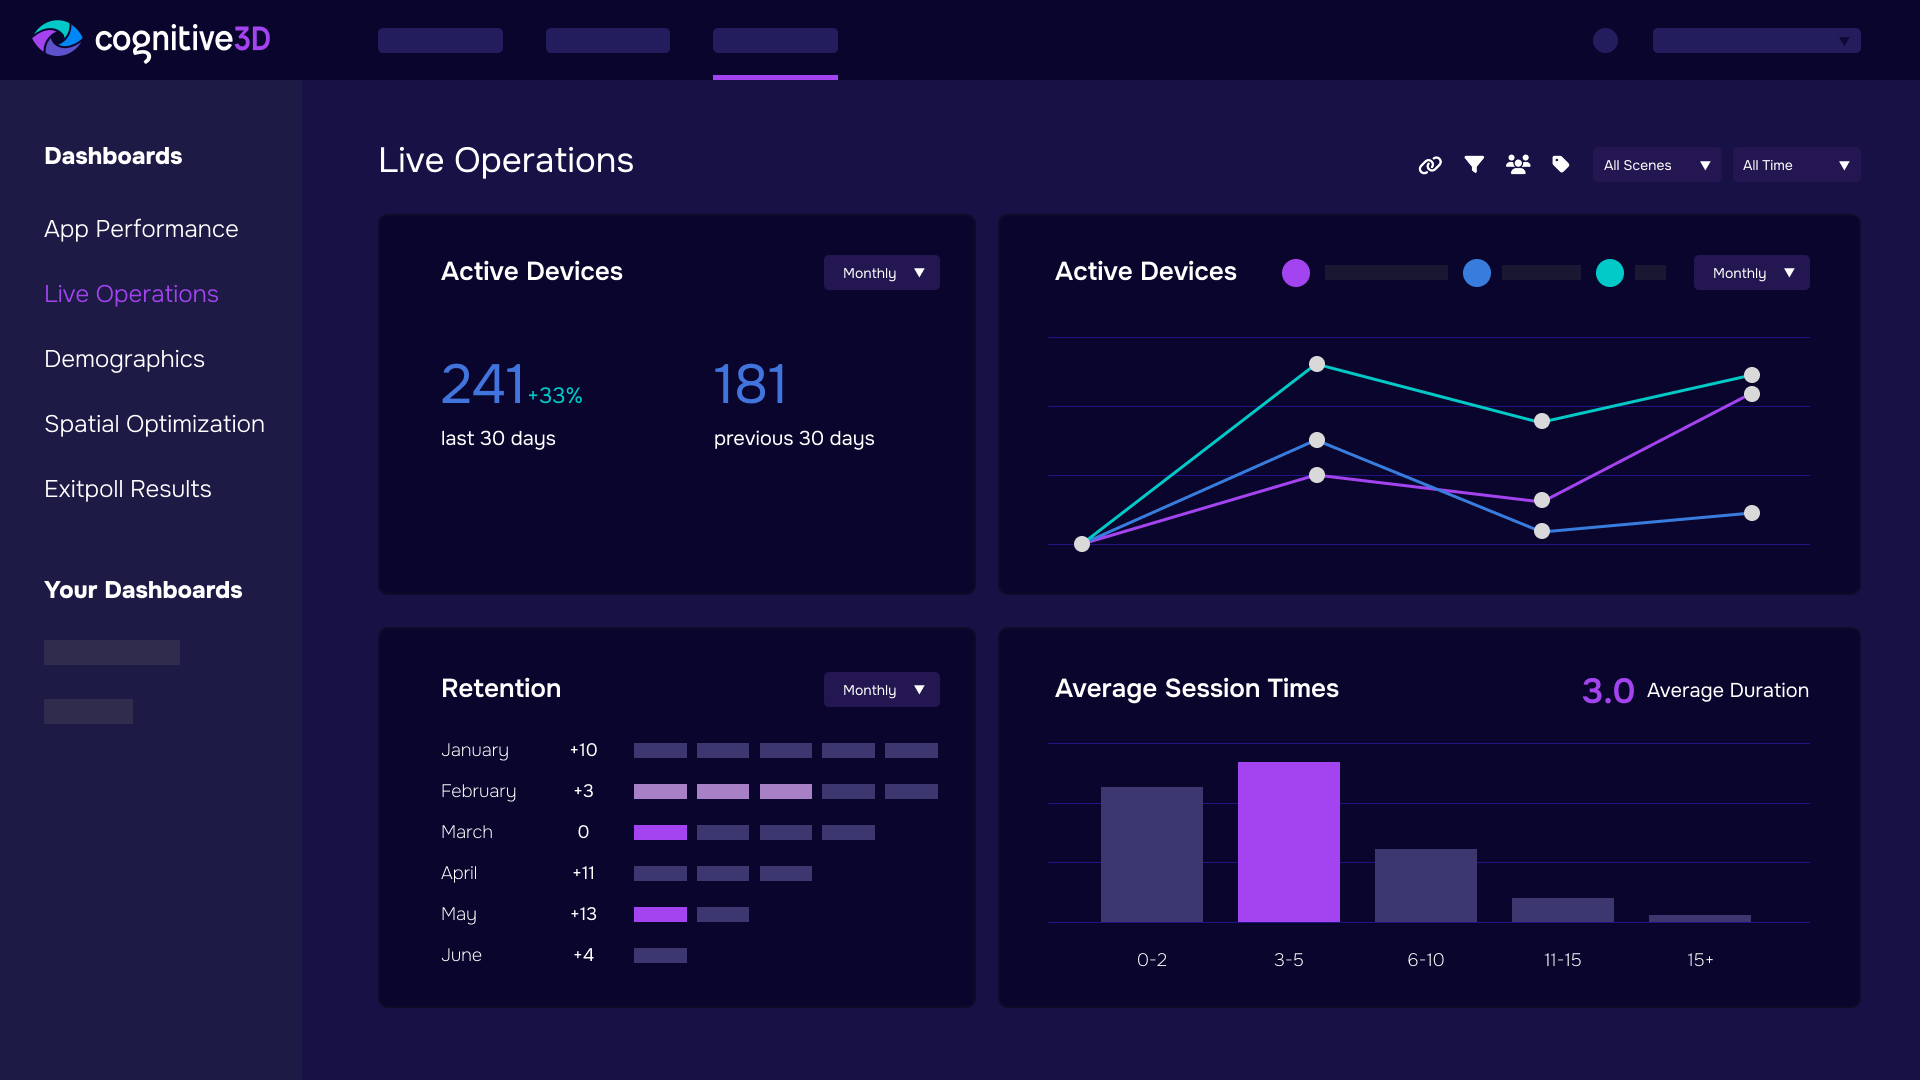
Cognitive3D’s Top-Level Metrics transform raw XR activity into a clear, intuitive understanding of project health. Instead of requiring teams to sift through logs or interpret complex event data, the dashboard immediately shows how many sessions took place, how long users stayed, and how cumulative time in VR is evolving across versions and scenes.
The interface reveals where engagement is rising and where it’s beginning to decline. Teams can identify which builds attract the most usage and whether specific scenes are outperforming others. All of this information is presented in a way that minimizes friction, helping teams reach insight without unnecessary effort.
This clarity enables faster decisions. It provides a reliable starting point for deeper investigation. And most importantly, it restores confidence that the experience is being evaluated based on reality, not assumptions.
Where Top-Level Metrics Lead You Next
The high-level view of an XR experience is powerful, but it also serves as an entry point for deeper discovery. Once the dashboard reveals a trend, whether positive or concerning, the natural next step is to explore the underlying behaviours that created it.
Cognitive3D makes this transition seamless. Teams can jump from the dashboard into individual session replays to observe how users move within the environment. They can analyze usage over time to uncover rhythm and seasonality. They can examine performance metrics such as frame-rate or battery drain to identify app stability issues. They can review objective outcomes to understand where users complete or abandon tasks.
Each of these layers provides context that enriches the top-level view. Together, they create a complete analytical ecosystem.
What Happens When You Finally See the Full XR Story
When teams open a dashboard that clearly reveals the full story of their XR experience, the way they work begins to shift almost immediately. Instead of scanning through scattered reports or chasing down conflicting numbers, they’re greeted with a cohesive view of engagement, session patterns, and overall experience health. It becomes possible to understand at a glance whether usage is increasing, whether participants are staying long enough to complete tasks, and how recent changes have influenced behaviour. This clarity brings a sense of ease and direction that simply wasn’t available before.
With that visibility, uncertainty starts to fall away. Rather than worrying about hidden issues or scrambling for last-minute insights, teams can focus their energy on thoughtful improvements. Product discussions become grounded in shared understanding. The confidence that comes from seeing the full picture allows teams to plan proactively, communicate more effectively, and experiment with greater purpose.
Over time, this steady visibility doesn’t just make analytics more manageable, it elevates the entire development process. Teams begin to operate with a stronger sense of alignment, accountability, and confidence. They are guided not by guesswork but by a continuously unfolding, data-driven story of their XR experience.
The First Step to Smarter XR Decisions
Gaining clarity doesn’t have to be complicated. Exploring your top-level metrics is one of the simplest and most effective steps you can take to better understand your XR experience. Cognitive3D removes barriers to entry, allowing teams to access actionable insights without setup delays or technical friction.
Even a brief moment inside your dashboard can reshape how your team thinks about engagement, performance, and experience quality. It provides the immediate grounding needed to make decisions with confidence.
Where to Go After Mastering Your Top-Level Metrics
Top-level metrics are just the beginning. Cognitive3D’s broader measurement framework offers deeper insights into behaviour, attention, performance, comfort, goal completion, and device usage. It’s a comprehensive ecosystem designed to help teams uncover not just what happened, but why it happened.
As teams explore more of this framework, they unlock new opportunities to refine their experiences, strengthen engagement, and scale their XR programs effectively. Top-level metrics open the door, then the full framework helps teams walk through it.