Browse a Full User Directory: Turn XR Participants Into Actionable Insight


Browse a Full User Directory: Turn XR Participants Into Actionable Insight
You Can’t Improve Experiences You Can’t Organize
Every XR experience captures far more than surface-level usage data. Each session records spatial movement, interactions, timing, device context, and performance outcomes. Over time, this creates a detailed, behavioural archive that reflects how people actually experience immersive environments.
The challenge is that XR data is inherently multi-dimensional. When that data isn’t organized around the people generating it, teams are left with fragmented views. Sessions become disconnected events instead of part of a larger behavioural story. Insights exist, but they’re buried under complexity.
Organizing data around users provides structure. It transforms raw session logs into something teams can comprehend, compare, and act on consistently.
When User Data Becomes Noise Instead of Knowledge
XR initiatives rarely stay small. What begins as a pilot or study often expands into multiple cohorts, locations, and versions. As this happens, participant data grows exponentially. New users enter the system while returning users accumulate long session histories.
Without a way to browse users directly, teams default to inefficient workflows. Analysts rely on exports. Designers review sessions one at a time. Stakeholders request summaries that take days to assemble. Simple questions become time-consuming investigations.
The problem isn’t data volume, it’s discoverability. When teams can’t quickly locate relevant participants or understand activity at a glance, data stops supporting decisions and starts slowing them down.
Why User-centric Thinking Changes How Teams Work
Session-based analytics answer “what happened.” User-based analytics answer “who is this happening to, and how does it change over time?”
This distinction matters. A single session rarely represents meaningful performance. Progress in XR is revealed through repetition, adaptation, and variation across conditions. Without a user-centric lens, those patterns remain invisible.
Browsing users allows teams to follow behavioural trajectories instead of isolated events. They can identify learning curves, fatigue, disengagement, and improvement. This changes how success is defined and how experiences are refined.
When teams understand users as ongoing participants rather than anonymous sessions, analysis becomes more strategic and less reactive.
From Participation Metrics to Measurable Progress
Many XR programs begin by tracking participation because it’s easy to measure. Session counts, total time in XR, and usage frequency provide early signals of adoption. But these metrics plateau quickly.
They don’t explain whether users are improving, struggling, or adapting. They don’t reveal where friction accumulates or where learning accelerates. Without participant-level visibility, teams can’t distinguish meaningful engagement from repeated failure.
A structured user view makes progress measurable. Teams can see how individuals move through experiences over time, how performance changes with exposure, and where outcomes consistently break down. Participation over time gives context and progress becomes the data.
What XR Data Reveals at Scale
As datasets grow, the cost of disorganization increases. Patterns that could guide optimization remain hidden simply because teams can’t see them clearly.
With a browsable user directory, trends surface naturally. Teams can identify groups that disengage early, cohorts that outperform others, and users who behave differently across devices or environments. These insights are difficult to uncover when data is only accessible through session-by-session review.
At scale, visibility is what enables foresight. Teams can spot issues earlier, validate changes faster, and make informed decisions without waiting for problems to escalate.
How the Cognitive3D User Directory Creates Clarity
Clarity in XR analytics starts with orientation. Before teams can analyze behaviour, performance, or outcomes, they need a clear understanding of who their users are and how those users are engaging with the experience. Cognitive3D’s User Directory is designed to provide that foundation.
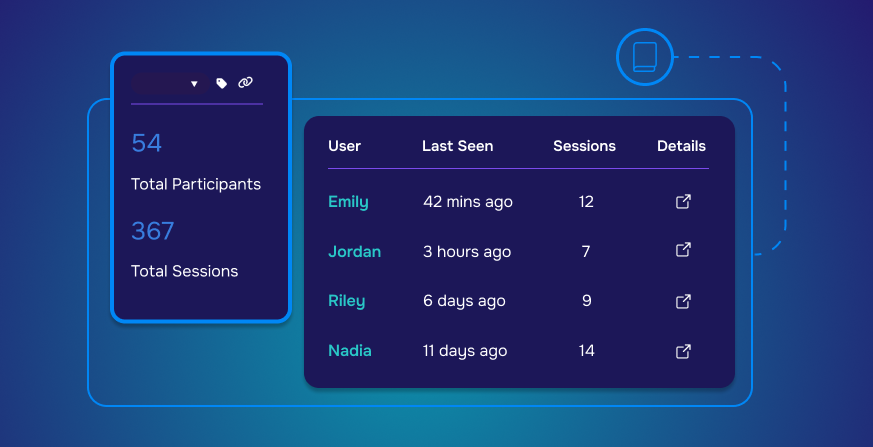
The User Directory acts as a centralized hub for XR participant management, giving teams a complete, searchable view of every user across all recorded VR and AR sessions. Instead of navigating through disconnected session logs or exporting raw data, teams can immediately browse users in one place and understand participation at a glance.
Each participant is presented with meaningful, high-level context. Information such as total sessions, recent activity, and last-seen timestamps allows teams to quickly assess engagement patterns, identify active or inactive users, and spot outliers that may require closer investigation. This is especially valuable for large-scale XR deployments where hundreds or thousands of participants generate data continuously.
From an XR analytics perspective, this structure reduces friction. Teams no longer need to build custom queries just to answer basic questions about user activity. The directory provides instant visibility, allowing analysts, designers, researchers, and stakeholders to start from a shared understanding of the user base.
More importantly, the User Directory connects directly to deeper analysis. From any participant, teams can move seamlessly into individual profiles, session histories, and detailed user behaviour tracking. This creates a continuous flow from overview to insight, linking participant management with behavioural analysis, session replay, and performance evaluation.
By organizing XR data around users instead of isolated sessions, Cognitive3D makes complex VR and AR analytics easier to navigate, easier to explain, and easier to act on. The result is not just better visibility, but a clearer path from raw data to confident decision-making.
Moving Beyond Browsing Users
Browsing a user directory is not about reviewing a list of names. It is about creating a clear starting point for behavioural analysis. In complex XR datasets, insight rarely comes from scanning raw events or isolated sessions. It begins with identifying which participants warrant closer attention and why.
A structured user view allows teams to quickly recognize meaningful signals. Patterns such as repeated participation, sudden drop-offs, unusually long sessions, or inconsistent performance become visible at a glance. These signals guide investigation, helping teams focus on the users and behaviours that matter most instead of reviewing data at random.
From there, analysis becomes intentional. Teams can move from a participant overview into detailed session histories, replay specific moments, and examine objective outcomes in context. Rather than asking broad, unfocused questions, teams follow a logical thread from “who is this user?” to “what did they experience?” and finally to “why did this outcome occur?”
This progression is what turns data into understanding. By connecting high-level participant visibility with detailed behavioural evidence, teams gain the ability to explain performance, diagnose friction, and validate design decisions. Browsing users becomes the gateway to insight; not the end of analysis, but the point where understanding begins.
When Data Is Organized, Decisions Become Confident
Confidence in decision-making doesn’t come from having more data. It comes from understanding the data you already have. In XR, where behaviour unfolds across space, time, and interaction, that understanding depends on how clearly information is structured and accessed.
When participant data is organized around users rather than scattered across sessions and exports, teams gain a shared frame of reference. Discussions shift from interpretation to evaluation. Instead of debating what might have happened, teams can point to observable behaviour, tracked progress, and consistent patterns across participants.
This clarity has practical consequences. Design changes are easier to justify because their impact can be traced to specific user behaviours. Performance issues can be prioritized based on frequency and severity rather than anecdote. Stakeholders gain confidence because insights are grounded in evidence that can be revisited and verified.
Over time, this organizational clarity compounds. Teams iterate faster, align more easily, and build trust in their analytics process. Decisions feel less risky not because uncertainty disappears, but because it is managed. When data is organized, teams don’t hesitate — they move forward with intent and assurance.
Start With Your Users
Every XR experience ultimately succeeds or fails based on how real people interact with it. Interfaces, environments, and tasks only matter insofar as they shape user behaviour. Yet too often, teams evaluate XR outcomes without a clear view of the individuals inside the experience.
Starting with users changes that dynamic. A full user directory makes participants visible as more than anonymous data points. It allows teams to understand who is engaging, how frequently they return, and how their behaviour evolves over time. This visibility provides essential context for interpreting performance, engagement, and outcomes.
When users are the starting point, analysis becomes grounded. Teams can connect design decisions to real behaviour, track progress across sessions, and ensure that improvements are measured at the human level, not just in aggregate metrics.
Continue Exploring
Browsing a full user directory is the foundation of a broader analytical workflow. Once participants are visible and organized, teams can move naturally into deeper investigation.
From individual profiles, teams can explore complete session histories, objective performance, and detailed behavioural data. Session replays add spatial and temporal context, while performance metrics and behavioural timelines reveal how and why outcomes occur. Each layer builds on the last, creating a coherent path from overview to insight.
Together, these tools form a connected system for understanding XR behaviour. Rather than isolated features, they work as a progression, helping teams move from awareness, to understanding, to confident action as XR programs grow in scale and complexity.
See how your XR data becomes insight. Book a demo to explore participant behavior, track progress, and understand what’s really happening inside your experiences.