Visibility Lives at the User Level: Unlocking XR Insights through Individual Profiles


The Missing Layer of XR Analytics: The Individual
In XR analytics, teams often focus on dashboards, heat maps, and high-level summaries. These views offer essential visibility into overall performance and engagement. They reveal patterns, trends, and the general health of your immersive experience, but they don’t reveal people.
Even the most advanced aggregate dashboards tell only part of the story. They show how groups behave, but they hide the unique behaviours that shape each user’s individual journey. And in XR, where movement, attention, and interaction vary wildly from person to person, those individual differences matter far more than most teams realize.
Every participant brings their own instincts, habits, spatial awareness, physical context, and comfort level to immersive technology. These factors dramatically influence how they experience your application. Two users in the same virtual environment may behave in completely different ways, and aggregated data simply cannot capture that reality.
With Cognitive3D’s insight, every user becomes visible as an individual. Their behaviour is observable, measurable, and fully reviewable, giving you insights into how real people interact with your experience.
Instead of treating your user base as a single data set, you can understand how every person moves, explores, learns, hesitates, succeeds, or struggles inside your application. This is the layer of insight that transforms how teams design, train, and evaluate XR.
The Real Limitation of Aggregate XR Analytics
Aggregate data is powerful, but it has a built-in blind spot: it hides variation. It can show you what’s happening on average, but it can’t tell you which users struggled, why they struggled, or whether the same individuals are repeatedly running into the same problems.
For example, if your analytics show 70% completion on a task, the remaining 30% represent a meaningful problem, but the aggregate metric won’t tell you who those users are or what affected their experience.
This is especially problematic in XR, where behaviour is influenced by a mix of environmental and personal factors. A user’s height may determine their visibility of key objects. Their available play space may affect how comfortably they can move. Their headset model may impact performance. Their familiarity with VR or AR may influence how intuitively they interact.
When you rely on aggregated XR metrics alone, these nuances disappear. Teams end up addressing symptoms instead of uncovering root causes. The most actionable insights remain hidden in the experience of individuals, not in the averages of many.
“Every User Has a Story — We Built Profiles So You Can See It.”
Tony Bevilacqua, CEO of Cognitive3D, explains it this way:
“When you can analyze each person individually, you stop guessing how people behave in XR. You can actually see it.”
XR is a deeply personal medium. Users don’t just click buttons; they explore space. They move with intention. They respond physically. Their behaviours reveal thought processes that traditional analytics cannot capture.
That’s why Cognitive3D treats every user as a complete behavioural story. Nothing is abstracted. Nothing is assumed. Each participant’s interactions, choices, challenges, and context are visible in a way that makes their experience unmistakably clear.
When you can see each user’s journey, you no longer need to rely on speculation. You gain the clarity needed to design intuitive experiences, support learners more effectively, and improve outcomes across your XR program.
The Power of Understanding Users Individually
Once teams begin reviewing individual XR profiles, they uncover insights that would never appear in aggregated data. The difference becomes obvious immediately: you’re not just seeing outcomes, you’re understanding behaviour.
You start noticing where people hesitate. You see which users explore confidently and which ones approach interactions cautiously. You can identify when someone loses focus or misses a cue entirely. You watch how they approach tasks, where they get stuck, and how they navigate scenes.
This level of detail is essential for training scenarios, where success depends not just on whether a user completes a task, but how they complete it. Two trainees may achieve the same outcome, but they may take completely different behavioural paths to get there. One may move fluidly and confidently. The other may pause repeatedly, backtrack, or misinterpret instructions.
These differences matter, and they only become visible when you can analyze behaviour at the individual level.
This same clarity benefits design, product development, and research teams as well. It reveals micro-interactions, unexpected behaviours, and unintended UX patterns that aggregated metrics simply cannot show.
Individual insight transforms the way teams understand their experience. It creates a feedback loop rooted in real behaviour, not assumptions.
Why This Matters: XR Users Don’t Behave the Same Way
After analyzing millions of sessions across the Cognitive3D platform, one truth has become unmistakable: there is no such thing as a typical XR user. Everyone behaves differently.
Some users immediately understand how to navigate. Others take time to acclimate. Some users fixate quickly on key objects. Others scan the environment in unpredictable ways. Some follow the intended flow effortlessly. Others invent their own paths, sometimes exposing hidden UX friction.
These behavioural patterns are not random. They reflect differences in device type, physical space, height, comfort, prior experience, and even individual personality.
And when you review users individually, these differences become impossible to ignore.
You can see which users consistently struggle with specific steps. You can identify who improves over time and who repeats the same mistakes. You can spot attention patterns that reveal design issues. You can uncover environmental or performance constraints affecting specific devices.
This is why individual analytics matter: they let you design for real people, not for the average that doesn’t actually exist.
How Cognitive3D Makes Each User’s Journey Clear
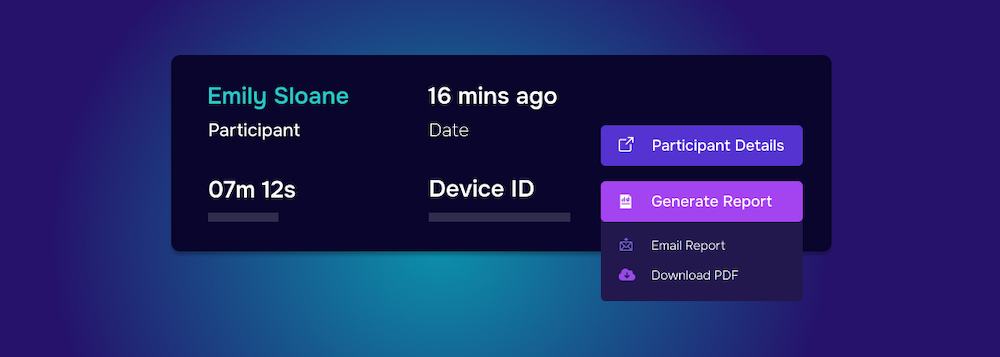
Cognitive3D automatically generates a complete individual user profile for every participant with a dedicated User Dashboard: a centralized, automatically generated hub that displays their full history inside your XR experience. This dashboard gives trainers, researchers, and product teams an immediate understanding of who the user is, how often they’ve participated, and how their performance has evolved across sessions.
From this single view, teams can jump directly into recorded sessions, review a complete timeline of interactions, assess objective outcomes over time, and see contextual details that influence behaviour. The User Dashboard acts as the anchor point for all deeper insights that follow, ensuring that every behavioural detail, performance trend, and session replay is always one click away.
Each profile includes:
A behavioural identity inside XR
You see who the participant is inside the immersive environment; where they’re located, how often they participate, what device they use, how long their sessions last, and even physical attributes like height and arm length when available.
A chronological session history
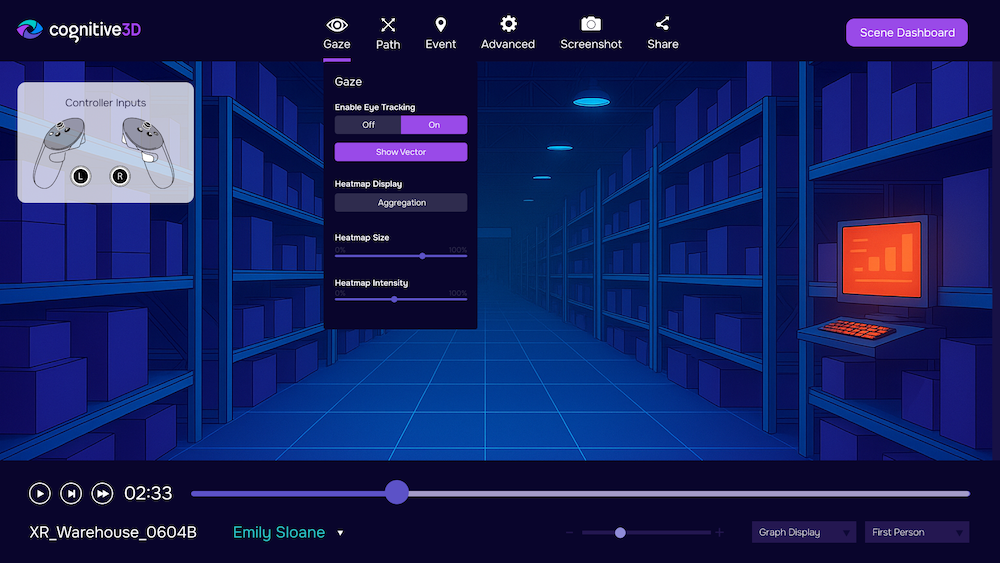
Every session they complete is logged, timestamped, and accessible. You can open any session instantly, view its metrics, and play back every moment inside the 3D session replay viewer.
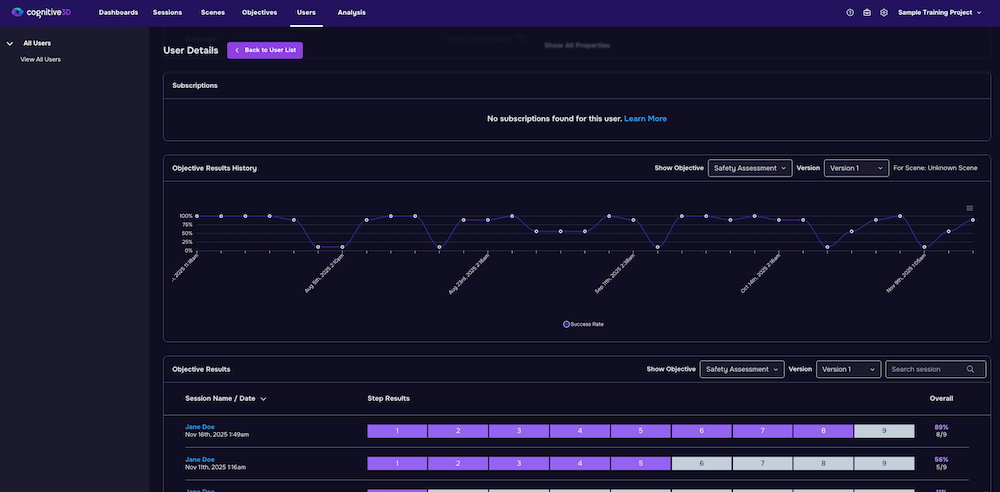
A deep view into performance
You can see how the user progressed through objectives, where they succeeded, where they hesitated, where they dropped off, and how their performance evolves over time.
A window into their real behaviour
Movement paths, gaze visualizations, fixation durations, interactions, idle behaviour, and navigation patterns all become clear.
Technical and situational context
Frame rate fluctuations, battery levels, CPU/GPU load, room size, and thermal performance are tied directly to their behaviour, giving you a complete view of what shaped their experience.
This level of granularity is what makes XR analytics truly actionable.
What Customers See When They Analyze Every User Individually
When teams start reviewing individual user behaviour, they often experience a noticeable shift in how they understand their XR workflows. Instead of interpreting broad averages or debating what might have happened, they can see exactly how each person interacted with the experience. Decisions become clearer because they’re rooted in observable behaviour rather than assumptions.
Organizations frequently discover patterns that were impossible to see with aggregate data. Some realize that issues affecting “many users” actually come from a specific group with similar device setups or environmental constraints. Others uncover entirely new insights: moments of hesitation, missed cues, unconventional navigation paths, or steps that users consistently interpret differently than intended.
These discoveries give teams a stronger sense of control. They can identify where individuals struggle, where they improve, and how their behaviour changes over time. They can also evaluate whether design or training adjustments truly solve the problems they were meant to address.
With individual-level insight, teams no longer have to guess why something happened. They can watch it unfold, understand the context, and move forward with confidence knowing they’re addressing the real cause, not just the symptom.
Watch the Experience Through Their Eyes
After exploring a participant’s profile, the next step is seeing their session from their perspective. A 3D session replay turns abstract data into a lived experience. You can watch where their eyes went, how their body moved, and how their interactions unfolded in real time.
This kind of visibility changes how teams think about XR. It reveals whether a user truly noticed an object, or only glanced at it briefly. It shows how they navigated the environment: confidently or with uncertainty. It makes moments of hesitation immediately apparent.
Replay transforms behaviour from numbers into stories. And those stories give you everything you need to improve clarity, usability, training flow, and design.
A Better Way to Build XR: One Individual at a Time
When you can analyze every user individually, you unlock a richer, more accurate understanding of how your XR experience truly works. Aggregate dashboards remain valuable, but they become far more meaningful when supported by individual insight.
The combination of high-level visibility paired with human-level detail empowers teams to design smarter experiences, support learners effectively, identify friction early, and iterate with confidence.
In XR, individual behaviour isn’t noise, it’s the signal.
When you can see every user clearly, you can build experiences that work for everyone, not just for the theoretical average.
See Your First Individual User Profile Today
Experience how powerful individual-level insight can be.