See XR Usage Over Time: Track Engagement, Retention, and Growth Trends


See XR Usage Over Time: Track Engagement, Retention, and Growth Trends
You Can’t Improve What You Don’t Track Over Time
Every XR experience creates activity: sessions launched, headsets used, users returning (or not). But what separates mature XR programs from experimental pilots is the ability to understand how that activity evolves.
Most teams can measure what happened today. Far fewer can explain what is happening over weeks, months, or quarters. And in immersive technology, where adoption is still fragile and stakeholder trust must be earned, those time-based patterns matter more than any single moment. Ongoing visibility into adoption trends is an important part of the analytics.
Usage isn’t just a number. It’s a narrative. It shows whether an experience is gaining momentum, losing relevance, or quietly stalling. And when you can’t see that narrative unfold over time, progress feels unpredictable.
When XR Engagement Has No Timeline
Most XR teams can tell you how many sessions happened. Few can tell you what changed.
Without time-based visibility, teams lose the ability to understand engagement health. Retention problems often surface too late to correct, while adoption drops are dismissed as isolated anomalies instead of early warning signs. Stakeholders begin to question momentum because there is no clear evidence of sustained usage.
Growth decisions become driven by instinct instead of proof. Review meetings turn into opinion-based debates. Roadmaps stall because no one knows whether the program is truly improving or simply repeating.
And over time, XR risks being labeled experimental instead of essential; not because it failed, but because the story of progress was never made visible.
Why Time-Based Usage Insight Matters in XR
Usage tracking isn’t an extra dashboard layer, it’s foundational to building better immersive software.
Cognitive3D exists to help teams understand what truly happens inside XR applications, not just within a single session, but across the full life of an experience as it evolves.
For developers, time-based usage patterns become an engineering signal. They reveal whether new builds improve engagement or introduce friction. They show whether users are returning consistently, whether devices remain active, and whether adoption is growing or quietly slipping away.
Without that sustained insight to engagement, teams can’t reliably prove iteration impact, measure rollout success, or manage XR applications as living systems.
Time-based usage insight turns immersive experiences into measurable products, and thus, something teams can improve, scale, and trust.
It also creates the connective tissue between product design and real-world behaviour. When engagement changes over time, it reflects something deeper: shifting user needs, evolving comfort, operational constraints, or hidden usability barriers. These are the signals teams need in order to iterate intelligently.
In immersive development, progress is rarely linear. Adoption often happens in waves, and retention is earned through consistency. Seeing those waves clearly allows teams to respond early, reinforce what’s working, and prevent silent decline before it becomes irreversible.
Ultimately, time-based usage insight is what allows XR to mature from novelty into infrastructure. This ability to measure progress over time creates analytics that organizations can rely on, optimize, and build long-term strategy around.
What Longitudinal XR Data Reveals
Across large-scale XR programs, consistent time-based tracking reveals patterns teams would otherwise miss.
Early drop-off often occurs within the first few sessions, long before teams realize engagement is slipping. Usage spikes frequently align with content updates, but only when retention already exists to sustain momentum.
In some cases, stable session volume paired with declining active devices signals hidden friction rather than success. Perhaps users are sharing hardware, sessions are clustering, or specific cohorts are disengaging.
These trends expose the true health of an XR program, while snapshots hide it. Time reveals whether engagement is durable, whether adoption is spreading, and whether momentum is real.
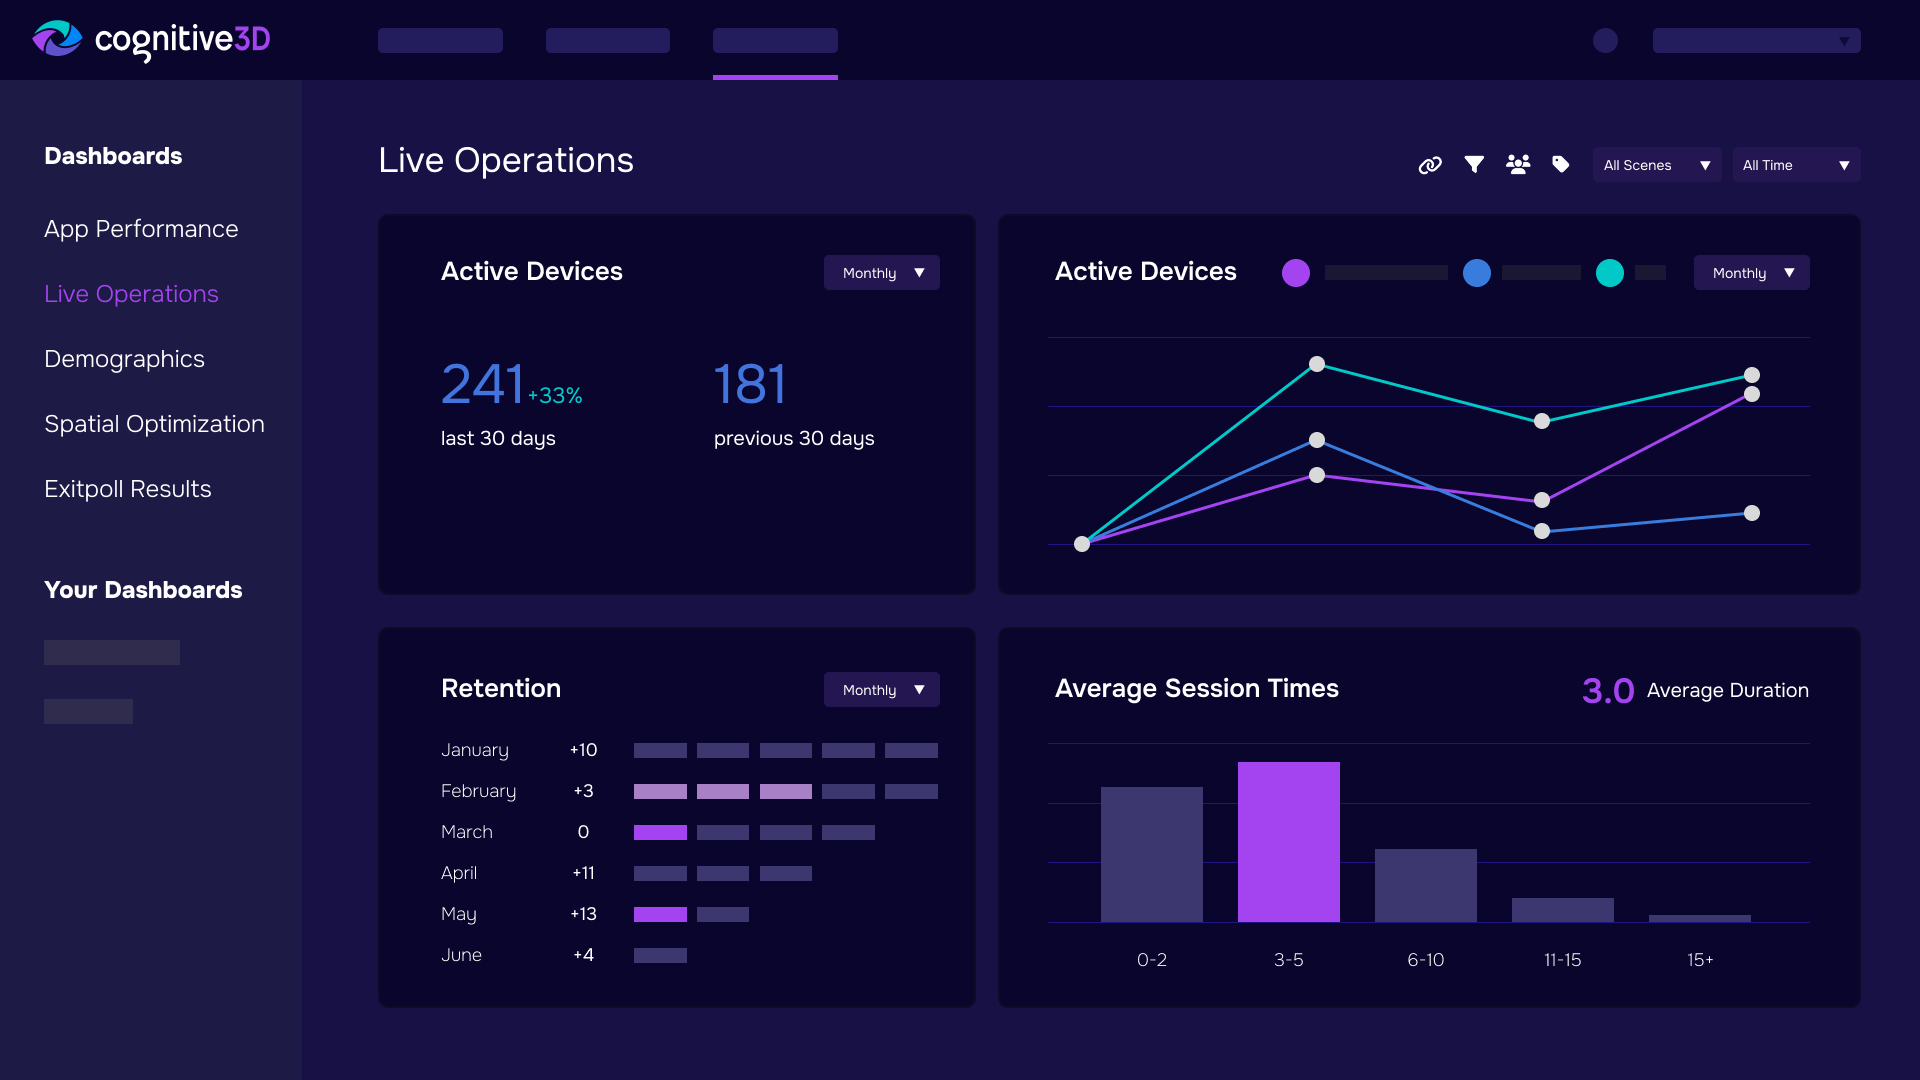
How Cognitive3D Lets You See Usage Over Time
Cognitive3D transforms raw XR activity into clear, time-based insight.
Immersive applications generate enormous volumes of session data, but without structure, that activity remains noise. Cognitive3D turns that noise into meaningful insight by organizing usage into clear trendlines that reveal how engagement builds, shifts, or declines over time.
With usage tracked across daily, weekly, and monthly views, teams gain more than a chart, they gain context. Patterns that would otherwise remain invisible become obvious: whether adoption is accelerating, whether retention is stabilizing, or whether engagement is quietly eroding.
This is especially critical in XR, where progress depends on iteration. When a new build ships, a training module changes, or deployment expands to a new cohort, the most important question is not what happened in one session, it’s whether behaviour improves across many sessions over time.
Time-based visibility makes that impact measurable. It shows whether changes create lasting momentum or temporary spikes, and it gives teams the evidence they need to steer development with confidence.
Instead of asking whether XR is working, teams can clearly see how it is evolving and guide decisions with certainty.
Engagement Trends Build Organizational Confidence
Time-based usage insight doesn’t just help analysts, it helps organizations build belief.
Inside most companies, immersive technology is still treated differently than traditional software. Early XR programs often begin as pilots, innovation initiatives, or experimental deployments. Even when experiences are successful, the proof is often anecdotal: a strong demo, enthusiastic feedback, a few visible wins. But anecdotes don’t scale.
What stakeholders need is continuity. They need to see that engagement is not a moment, but a pattern. That adoption isn’t isolated, but sustained. That usage isn’t spiking randomly, but growing with intention.
When teams can show that people are returning week after week, that sessions are increasing over months, and that retention is strengthening instead of fading, XR stops feeling like an experiment. It starts looking like infrastructure.
This is where momentum becomes more than a metric. It becomes a strategic asset. Usage trends provide the evidence leadership needs to fund expansion, justify investment, and commit resources with confidence.
Because scaling XR isn’t only about building great experiences, it’s about proving they endure.
Connect the Dots: From Usage Trends to Performance Insight
Once you understand when usage changes, the next question is why.
Time-based engagement patterns are rarely random. A decline in sessions may reflect deeper technical friction. A spike may be tied to a rollout, a new training module, or a moment of renewed relevance. A plateau may signal that users have reached the limits of the current experience.
That’s why usage trends act as the backbone of broader performance insight. They provide the timeline that gives every other metric context.
At the highest level, overall usage connects naturally to top-level health indicators. Session volume, time spent in XR, and average engagement only become meaningful when viewed over time: showing whether an experience is growing, stabilizing, or fading.
Usage trends also help teams interpret performance issues more clearly. If engagement drops after a new release, the cause may not be content at all. The issue may be stability, framerate degradation, or crashes that quietly erode trust. Time-based visibility helps teams correlate adoption shifts with underlying technical signals.
And for organizations managing XR at scale, usage patterns become even more powerful when segmented. Different cohorts may adopt differently. Certain devices may show higher friction. Specific regions or versions may behave in unexpected ways. Custom dashboards allow teams to break trends down by the dimensions that matter most, turning broad usage curves into precise operational insight.
In this way, tracking usage over time doesn’t sit beside other analytics, it connects them. It’s the throughline that transforms isolated metrics into a coherent story about what is working, what is changing, and what needs to improve.
When Time Reveals the Story, Teams Lead with Confidence
Healthy XR programs don’t guess their trajectory, they watch it unfold.
This is because immersive experiences are not static products. They are living systems, shaped by human behaviour, comfort, learning curves, hardware variability, and changing operational conditions. And that means success is never defined by a single session.
What matters is consistency. Momentum. Whether people return. Whether engagement compounds. Whether an experience becomes embedded into training, operations, or workflow, or quietly fades after the novelty wears off.
This is why time-based insight is so essential.
When teams can see usage evolve, they stop operating in the dark. They stop relying on isolated feedback or one-off pilots to judge success. Instead, they gain the ability to measure adoption as a real pattern: something that strengthens, weakens, or shifts over time.
For developers, this creates clarity in iteration. Every update becomes measurable. Teams can prove whether a build reduced friction or introduced instability. They can see whether engagement improved sustainably or only spiked temporarily.
For training leaders, this becomes credibility. Sustained usage shows that learning systems are being adopted, that sessions are being completed consistently, and that immersive training is becoming dependable rather than experimental.
For executives, this becomes trust. Trends provide the confidence to scale investment, expand deployments, and treat XR as infrastructure instead of an innovation gamble.
When usage trends are visible, decisions become proactive rather than reactive. Iteration becomes intentional, guided by evidence instead of assumption. And progress becomes provable, not just in reports, but in momentum that leadership can see.
Start Tracking XR Engagement Over Time
See how your XR usage evolves, not just how it performs today.
No setup friction. No guesswork. Just clear visibility into adoption, retention, and momentum.
See Trends Over Time with Cognitive3D.