Analyze Trends Across All XR Sessions
Monitor Trends in XR Across Your Experience
Always know the health of your XR experience. Track usage, comfort, and app performance trends or build your own with custom dashboards
View Top-Level Metrics
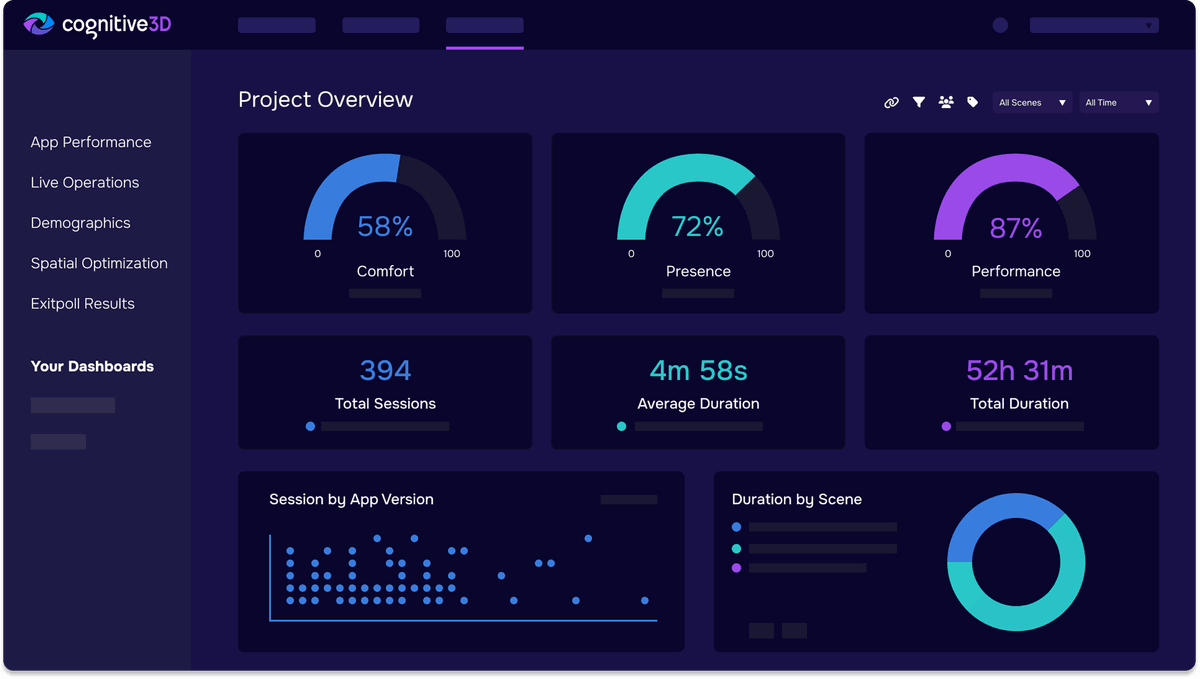
Monitor key metrics like total sessions, time in XR, and session length. Top-level dashboards help you quickly understand experience health across versions, scenes, and user activity using available platform data.
Create Custom Dashboards
Design your own dashboards with flexible layouts, charts, graphs, and saved custom queries. Filter by date, tag, and attributes to get clear insights.
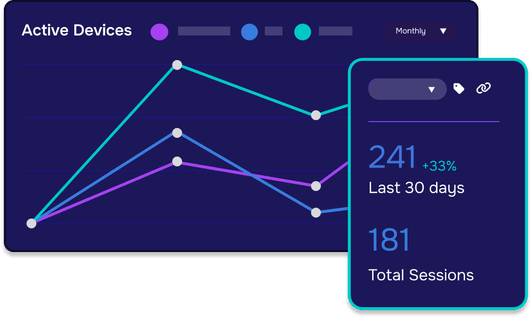
See Usage Over Time
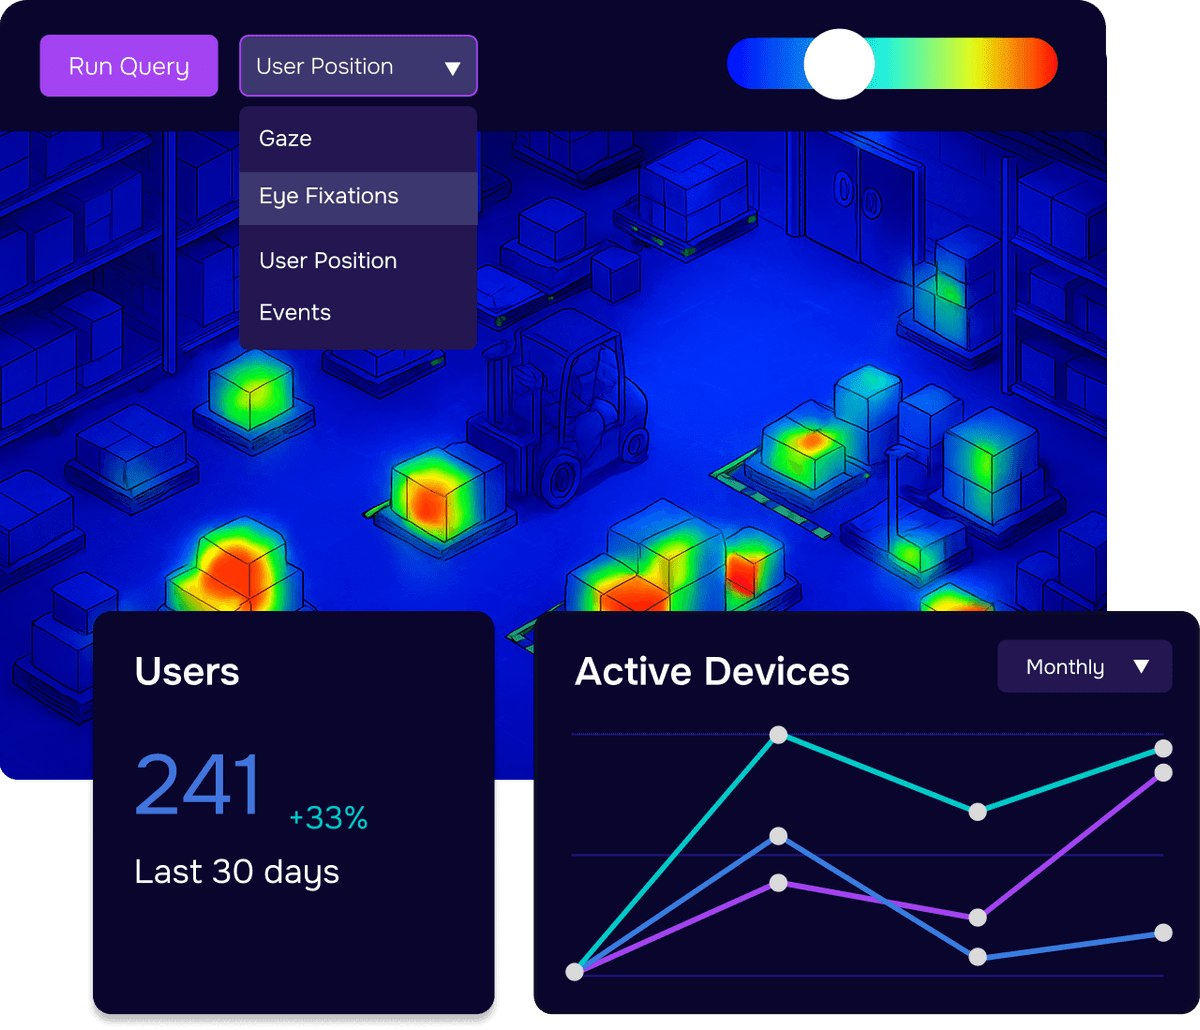
Track how user activity changes over time through daily, weekly, and monthly trends. Gain insight into retention and device counts while identifying whether activity is growing, stable, or declining.
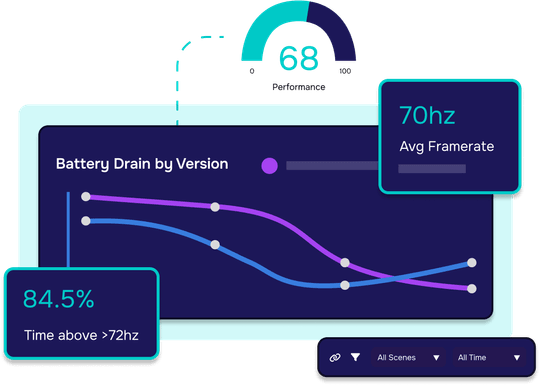
Monitor App Performance
Track app performance across scenes, versions, and devices to assess stability and publishing readiness. Visualize framerate trends with heatmaps and timeline overlays to quickly identify drops, crashes, and bottlenecks using device data.
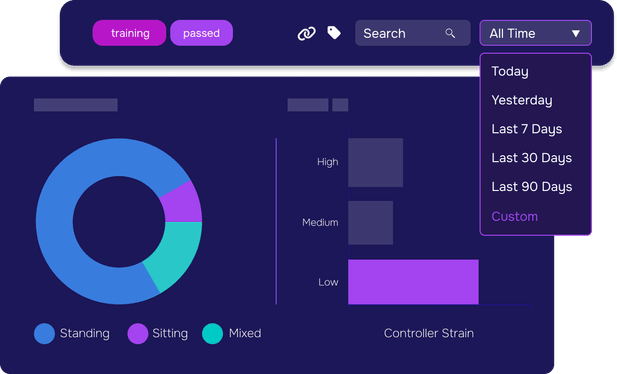
Evaluate Comfort & Immersion
Identify physical strain during XR sessions through posture, motion intensity, and body orientation. Further evaluate immersion by monitoring boundary hits, movement coverage, and scene engagement through user behaviour data.
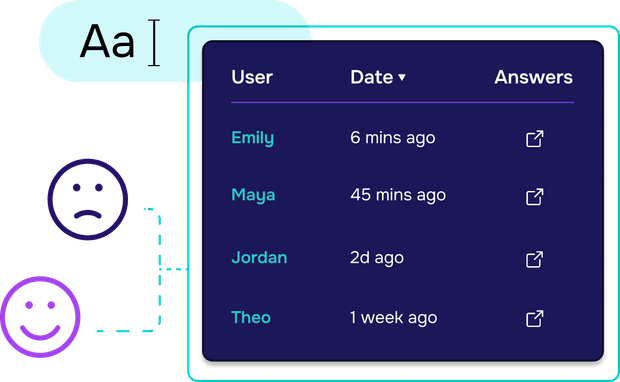
Summarize User Feedback
Review feedback collected in XR with timestamps and scene context. Compare responses across users and sessions to uncover trends through visual dashboards and charts.
Compare Location & Setup
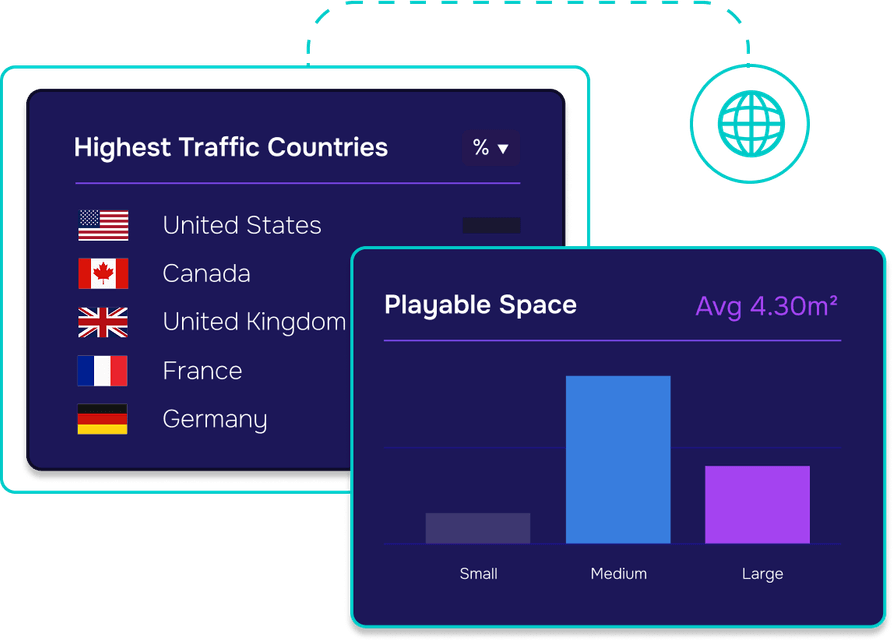
See where users are located and how they play. Review geographic distribution by country or region, play area size from small to extra large, and whether sessions are stationary or room-scale using captured device data.

“Relying on data to drive content updates is the holy grail. Cognitive3D offers the deepest analytics I've seen for immersive experiences, letting us base every creative, UX, and UI decision on data.'
ready to see What Every User Did?
Replay sessions, review profiles, and uncover performance insights across individual behaviours.
Analyze Behaviour Across XR Sessions
Visualize navigation, attention, and goals across sessions to uncover common behaviours, engagement trends, and how tasks are completed in XR.
Compare Sessions in 3D
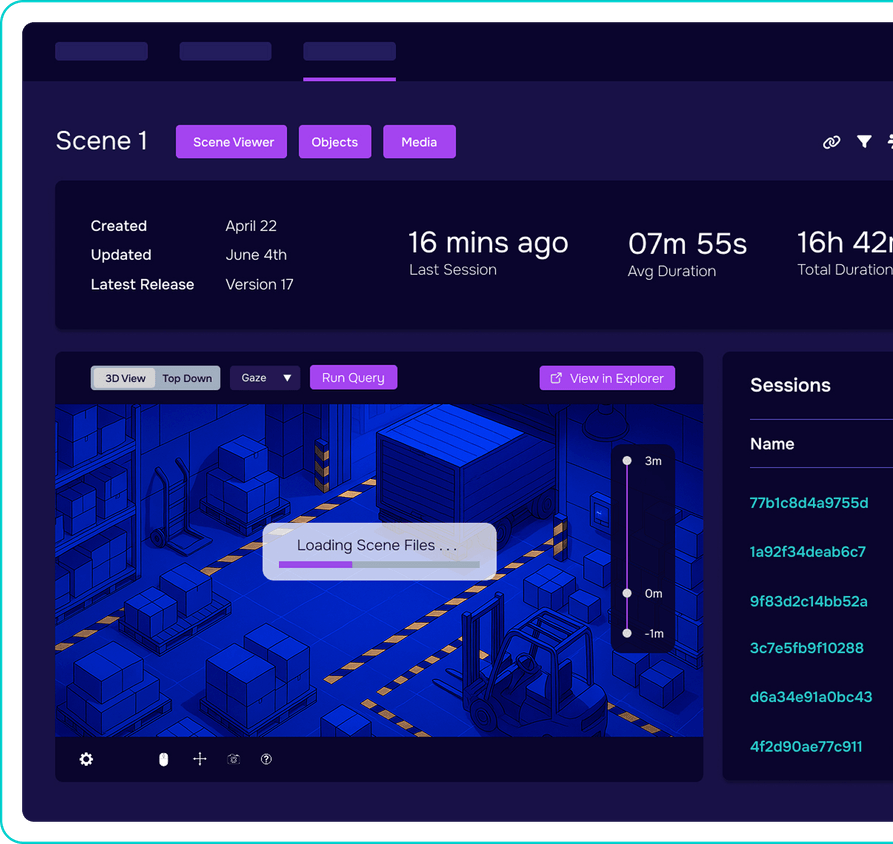
Explore multiple sessions in a single 3D environment to compare movement, behaviour, and activity. Navigate scenes with in-browser controls, toggle lighting or geometry, and share a link timestamped camera view for easy collaboration.
Segment & Query Data
Use flexible filters and custom tags to segment session and user data for faster analysis. Run custom queries with simple or advanced logic, and visualize results through dynamic charts for deeper insights
Analyze Goal Outcomes
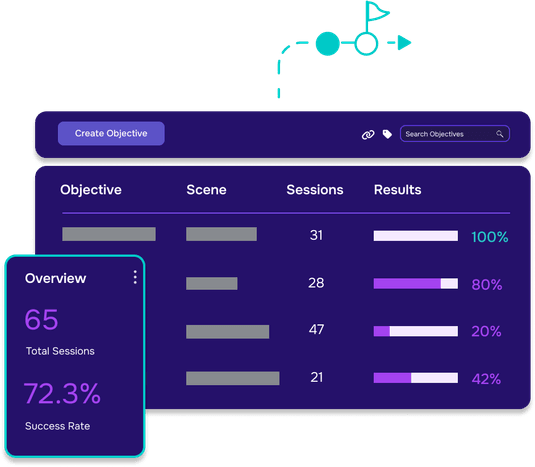
Review how users progress through tasks with step-level insights including duration, completion rates, and abandonment. See partial progress, total completions, and timing across sessions to identify points of friction and success.
Discover How Objects are Used
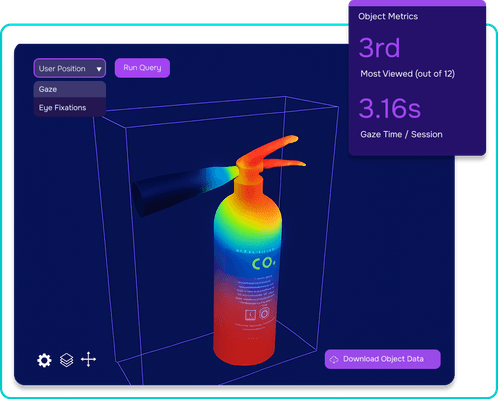
Analyze which objects receive the most attention by comparing interactions, fixation time, and session frequency. View each object in 3D with overlays showing gaze heatmaps and fixation points across sessions.

“Seeing one session gives you context. Comparing thousands reveals patterns. That's how product teams uncover what truly drives performance in immersive experiences.”
Ready To See Inside Your XR App?
Start capturing real user behaviour, app activity, and device inputs in full 3D.
Continue Exploring the Platform
Capture What Happens in XR
Start at the source with detailed tracking of app activity and device inputs – all in real time.
Learn MoreExplore What Each User Did
Discover usage patterns, performance issues, and behaviour trends across versions, scenes, and users.
Learn More


