Cognitive3D Releases Custom Dashboards


Cognitive3D Release Custom Dashboards
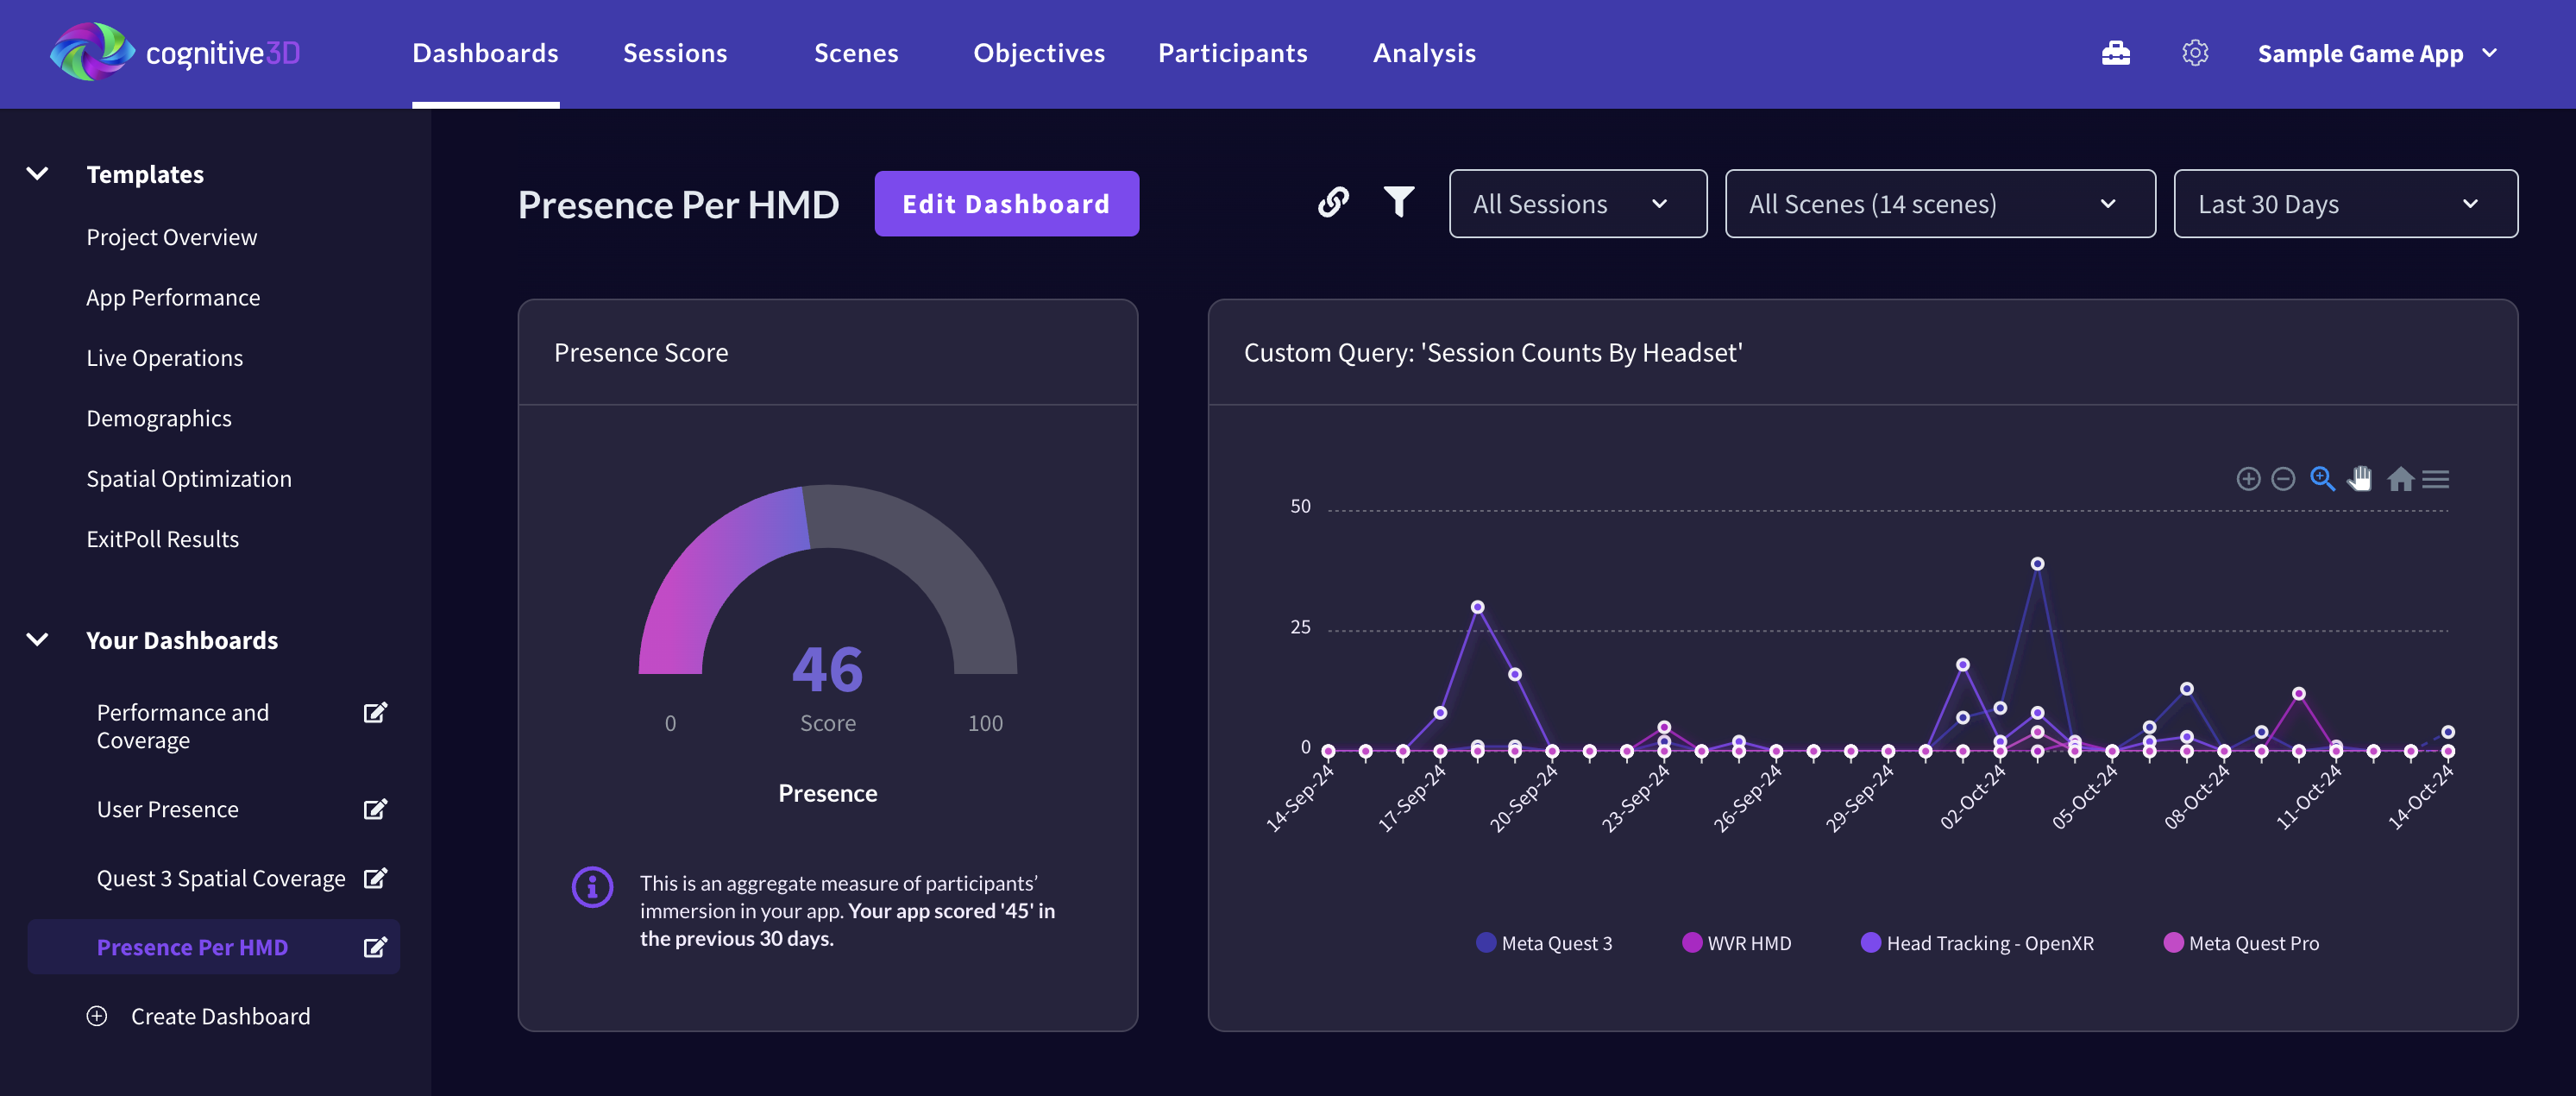
We’re excited to announce the launch of Custom Dashboards, this new feature gives you control of how you view and interpret spatial data. Focus on what matters most to you and get deeper, more actionable insights.
Highlights:
- Create, edit, and delete dashboards: Stay organized by setting up multiple dashboards for different projects or teams, and easily update them as your needs change.
- Custom Analysis Tool queries: Alongside standard metrics like Comfort and Presence Scores, you can add your own custom queries to view the data that’s important to you.
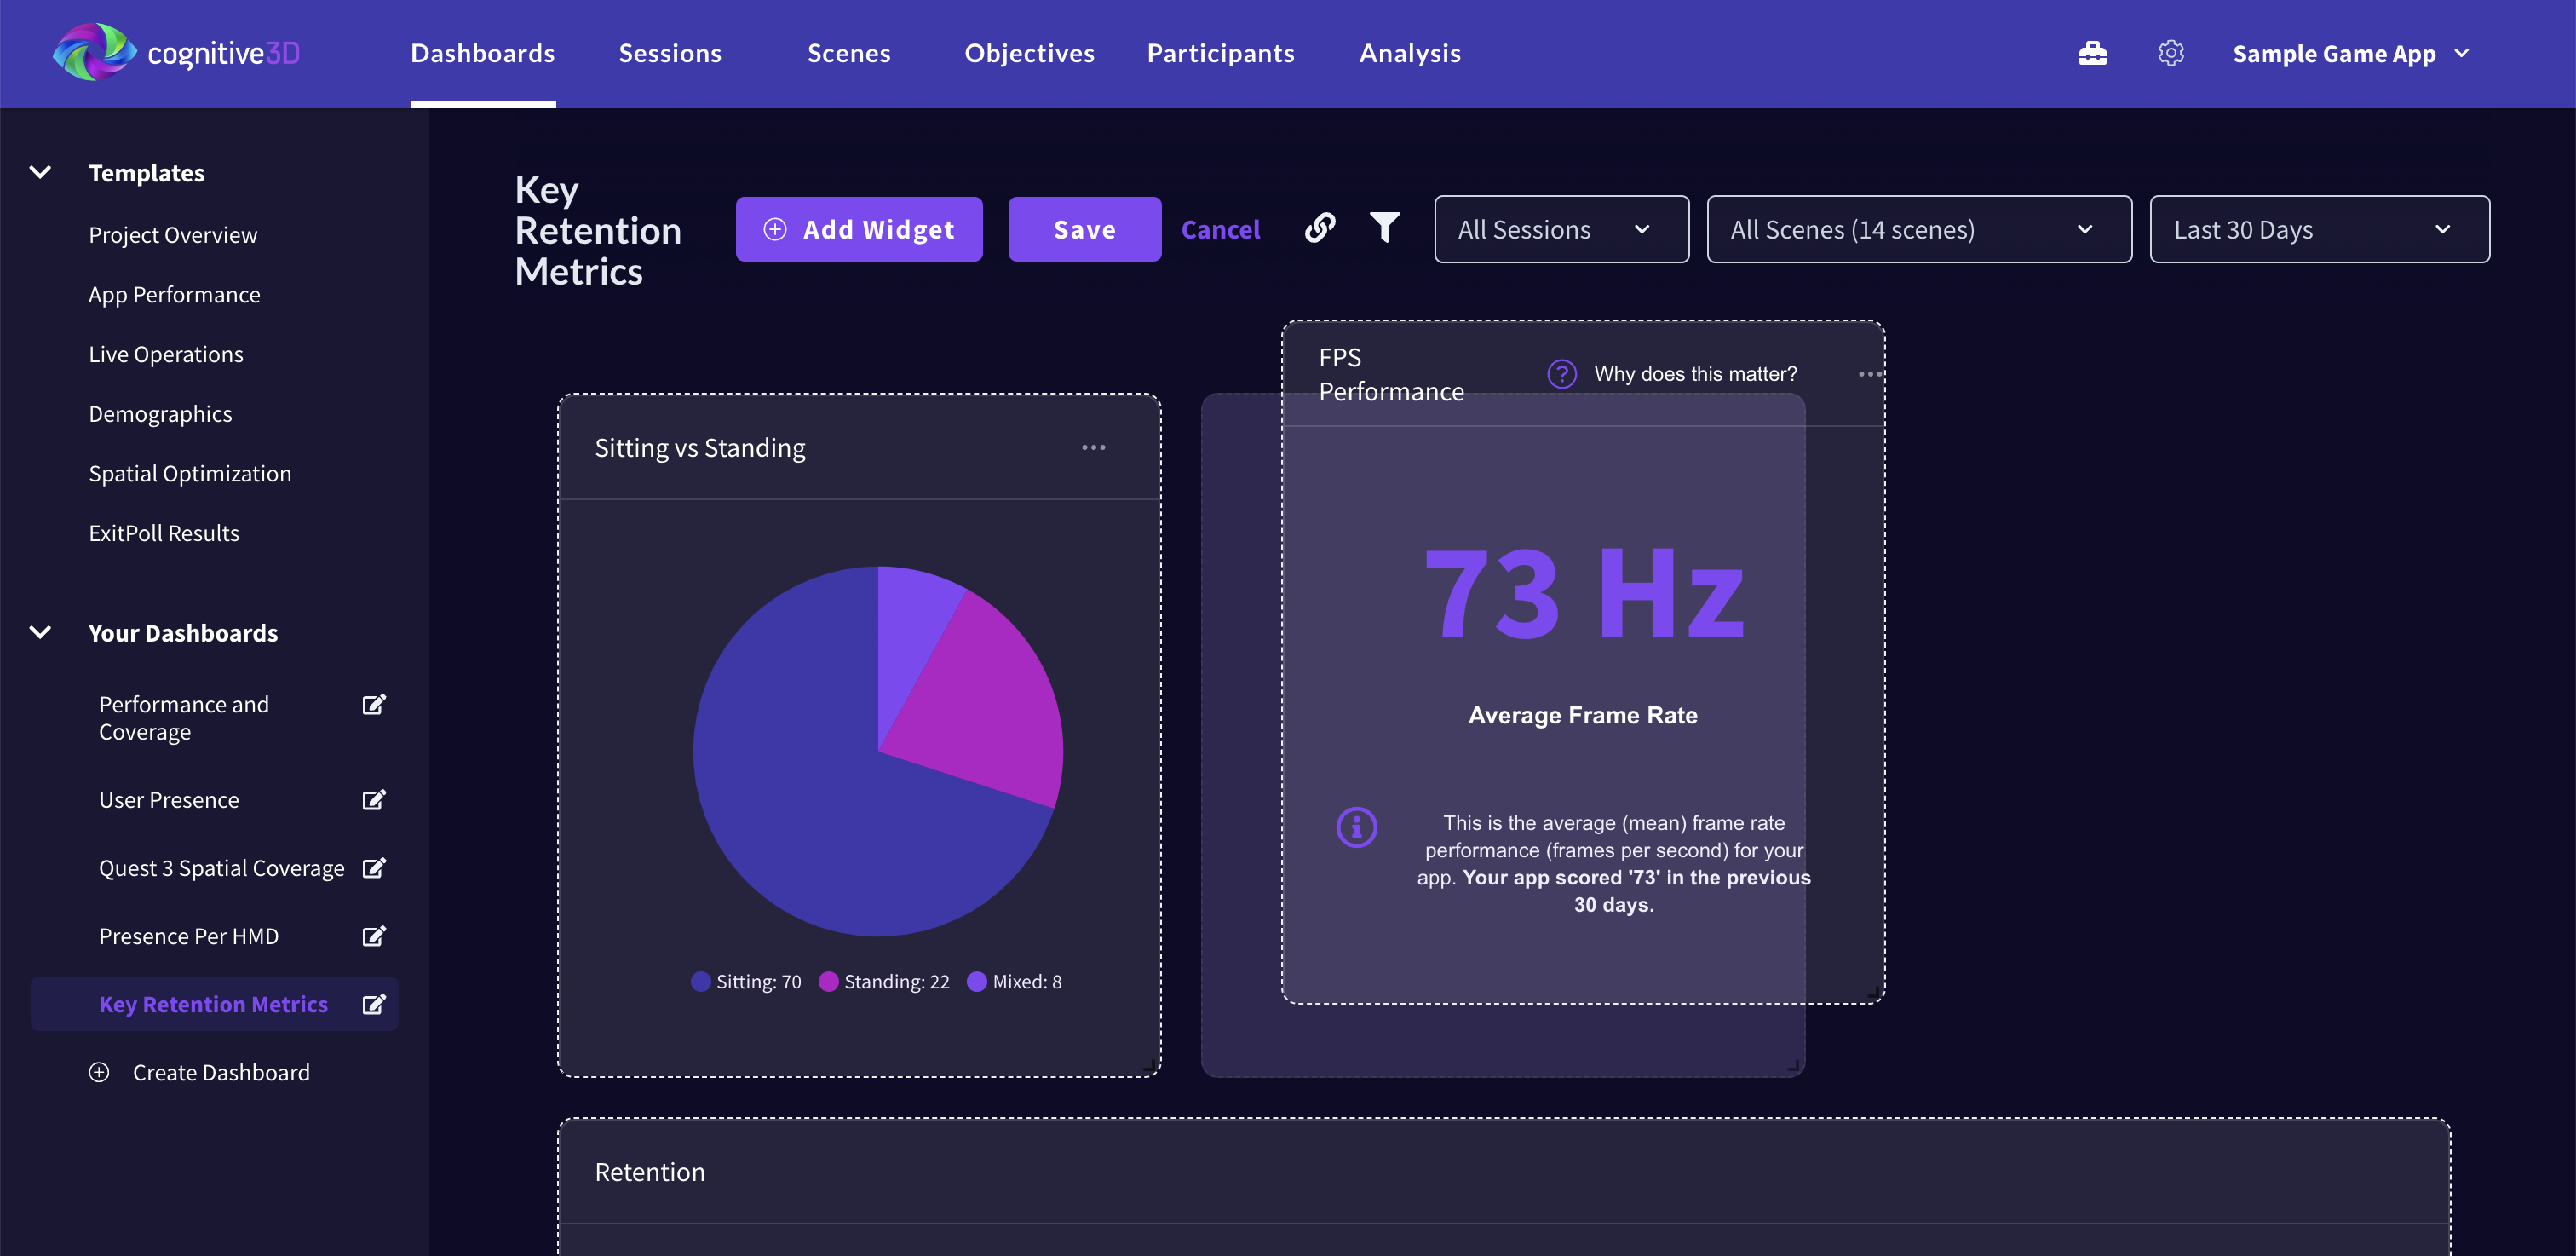
- Customize your layout: Easily move widgets around, resize them, and save dashboard configurations to keep your most relevant data front and center.
Benefits:
- Focus on What’s Important to You: Custom Dashboards let you tailor your view to show only the data that matters most. Whether it’s tracking how users interact with 3D objects or understanding user pathways.
- More Personalized Insights With Custom Dashboards: Every team member can create their own dashboard to fit their specific needs. This means product managers, developers, and analysts can all focus on the metrics that are most relevant to them, improving decision-making and collaboration.
- Simplify Complex XR Data: Data can be overwhelming, but Custom Dashboards simplify the process. By customizing your layout and keeping key metrics at the forefront, you can quickly spot trends and take action to improve user experience.
Transform Your XR Analytics Experiences
Custom Dashboards offer a new level of flexibility and control in how you view and manage spatial data. Whether you’re improving user engagement, optimizing training sessions, or enhancing your XR product’s user experience, Cognitive3D’s Custom Dashboards provide the insights you need.
Ready to unlock the full potential of your XR experiences?
Try out Custom Dashboards today and take your insights to the next level. Contact us to schedule a personalized demo and see these powerful new features in action.