Using Spatial Analytics to Scale Research Processes and Increase Productivity


Virtual reality (VR) and augmented reality (AR) is revolutionizing consumer research. Traditionally researchers used eye tracking to record 2D videos in first person while they shopped. But 2D videos lack depth, limiting the types of insights that can be gathered.
Human supervision is required for analyzing what happens on the screen. Researchers must manually scrub through each video and define Areas of Interests (AOI). Rectangles are used to outline AOIs which provide context about the video. AOIs can be anything deemed important to track and include signs, products or labels. Evaluating research outcomes for aggregated data is tedious and difficult to scale.
AOIs provide context to the building in this video
The challenges above can be solved with VR/AR because researchers receive access to spatial insights that weren’t previously available before. 3D environments have different properties than 2D screens. Layers within the environment make it simple to assign context to objects. Once tagged, data is automatically recorded when participants interact with or focus on them.
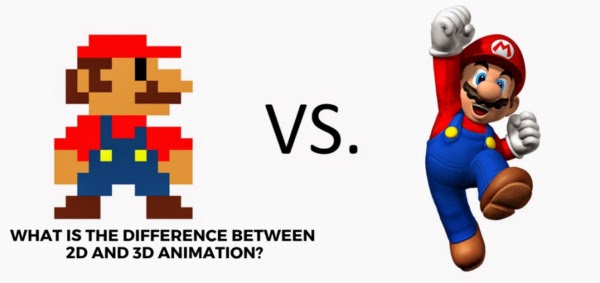
To illustrate this concept, let's compare the experience of playing Super Mario on the Nintendo Classic and playing Mario on the Nintendo Switch. Don’t get me wrong, the original Super Mario is great but it’s a vastly different experience. The Mario on the left is flat, there’s nothing more to the image.
On the other hand, the Mario on the right has properties such as thickness and depth. It is possible to view him from different perspectives. 3D insights let you capture deeper insights into buying behavior that would’ve been missed before.
How does this apply to consumer research? Let’s compare the traditional research methods to VR/AR research methods.
Scenario 1: Researchers want to find out which product was seen the most across the hundreds of sessions in the study.
Traditional Research Method:
Researchers need to manually scrub through all of the video sessions and draw rectangles over the products on the video timeline. When participants look at the rectangles, it gets counted as a hit. This process take hours and relies on human intuition.
VR/AR Research Method:
In contrast, spatial analytics within VR/AR can analyze and determine the results in seconds. Every product can be tagged 3D engine by using Cognitive3D’s Object Explorer tool.
To find out which product was seen the most, the researcher would simply sort the sessions by "Gaze Ratio" and get a list of objects ranked by the percentage of sessions in which the object was seen.
Scenario 2: Which participants looked at the product, picked it up, but didn’t end up purchasing it.
Traditional Research Method:
Once again, The researchers would manually scrub through all of the videos one by one to determine this.
VR/AR Research Method:
Here we use Cognitive3D's Objectives Tool to systematically collect biometric data from a wide range of research subjects with an unsupervised research outcome that does not require manual processing of AOIs. Then evaluate multiple steps as part of a hypothesis
For example, we can set up a sequential or non-sequential process based on eye tracking and interactions to qualify participants fit the criteria below.
- Participant looked at the Product.
- Participant picked up the Product.
- Participant did not purchase the Product.
The Objectives Tool automatically counts whenever a Participant meets the objective. It is completely customizable and can be used to prove hypotheses and and quantifiable outcomes. By using the Objective Tool, researchers can receive valuable insights into consumer behavior and better understand what factors lead to successful outcomes.
Detailed Object Insights:
3D objects also make it possible to collect data from multiple faces of a product. If you're interested in how participants interacted with specific products. Our Object Explorer dashboard heat maps show you which areas receive the most attention by overlaying user gaze and eye tracking data.
Here, we can also see a list of metrics that are captured when participants interact with the product.
We can find out:
- How long the product was looked at;
- What order it was seen in relation to the other objects;
- How many times it was seen across participant sessions
- How many times it was purchased.
These metrics can provide answers to any research questions you may have. Did they look at the product label? ingredients? nutritional facts?
Consumer Research At Scale
Spatial analytics gathered from 3D environments like VR/AR are transforming the way that consumer research is done. Researchers receive access to an entire new dimension of insights, providing a scalable process for collecting, categorizing and analyzing data. VR/AR simulations can dramatically increase productivity and saves researchers hours of manual labor. Cognitive3D's platform gives them the most advanced tools available to get outcomes from 3D environments.
Interested in a free product trial? Book a spatial analytics demo and transform your consumer research process today.