Object Groups: See What Captures Attention Across Product Categories in XR


A New Way to Compare Brands, Shelf Placement, Packaging, and Object Performance inside Cognitive3D
In XR research, attention tells a story, but attention is rarely just about one object.
Where people look, what they return to, and how long they focus on an object can reveal what stands out, what gets missed, and what shapes a decision. That kind of insight is especially powerful in retail merchandising research, CPG product testing, product placement studies, training simulations, automotive evaluations, and any immersive experience where objects play an important role.
A merchandising team may not only want to know whether one item received gaze. They may want to know which brand attracted the most attention across the shelf, whether products at eye level held attention longer, or whether a specific packaging attribute influenced what shoppers noticed first.
That is where Object Groups comes in.
With Object Groups, teams can organize dynamic objects into custom categories and review gaze and fixation results at the group level. Instead of analyzing each object one at a time, research teams can compare the product categories, placements, attributes, or object types that matter most to the study, directly inside the Cognitive3D platform.
From Individual Objects to Deeper Insights
Cognitive3D already helps teams understand how users engage with objects in XR. Teams can track object engagement, record where users look, and analyze how objects are used across sessions.
Object Groups builds on that foundation by helping teams move from individual object analytics to broader category-level insight.
Instead of stopping at individual object results, teams can create their own comparison model. In a retail or CPG study, that might mean comparing products by brand, shelf placement, price point, flavour type, pack count, or packaging style. In a training simulation, it might mean comparing attention across equipment categories. In an automotive study, it might mean comparing gaze and fixation across different vehicle features or variants.
The same set of dynamic objects can be viewed through different lenses depending on the research question. One analysis might compare brands, another might compare shelf zones, while another might compare product attributes.
That flexibility matters because real-world decisions are rarely made one item at a time. Merchandising, product design, and research teams often need to understand patterns across categories before they can decide what to change.
Object Groups makes those patterns easier to see.
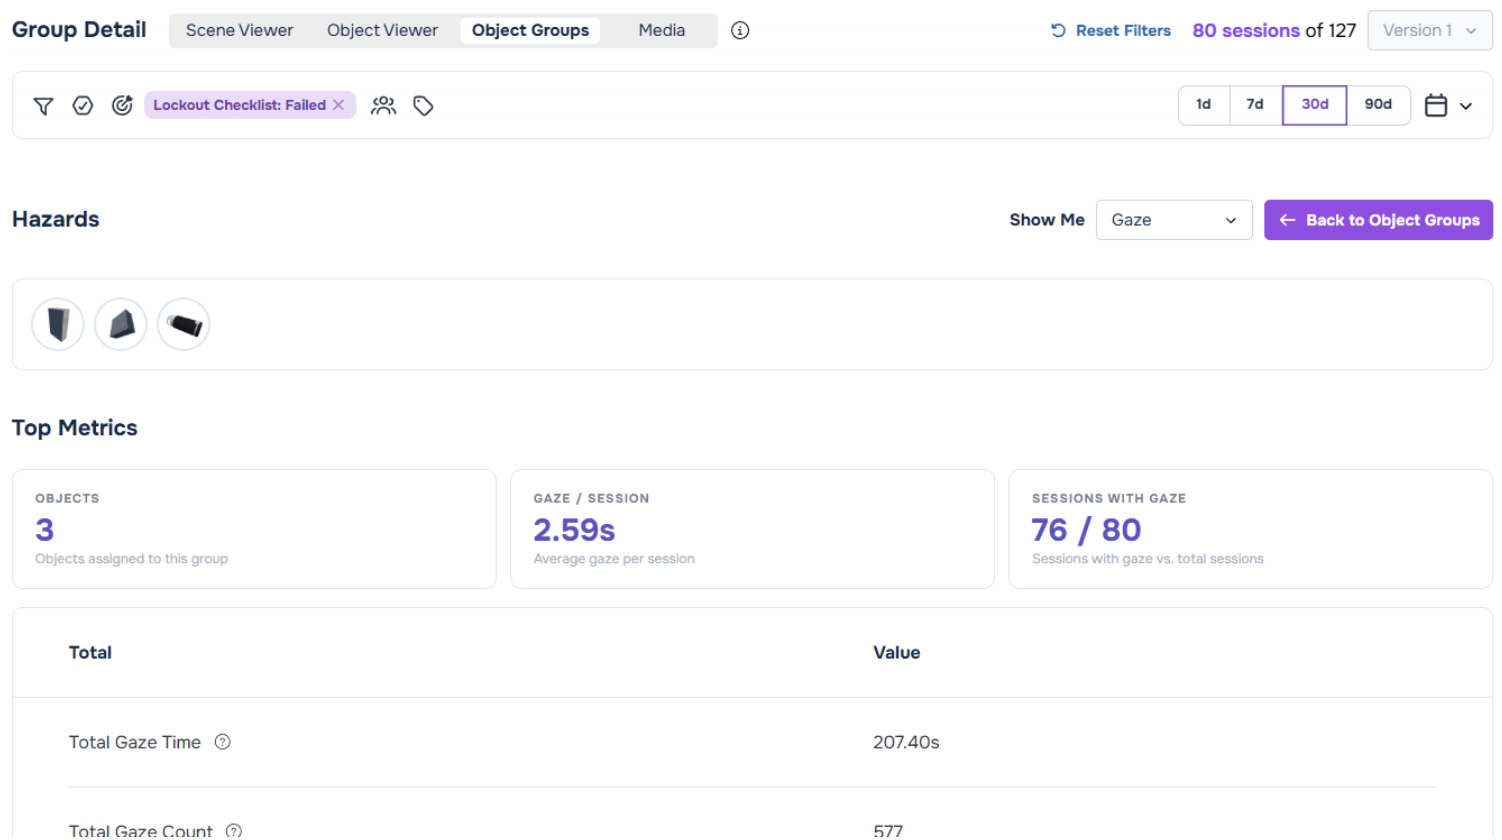
Built for the way Research Teams ask Questions
Object Groups is designed around a simple idea: the structure of the analysis should match the structure of the question. Instead of forcing teams to export data, sort object IDs, and build their own comparisons in spreadsheets, Cognitive3D now lets teams define the groups that matter to them inside the dashboard.
For example, in a virtual shelf study, a team may want to understand which brand received the most visual attention across all related SKUs. They may also want to know whether products placed at eye level held attention longer than products on lower shelves. A packaging team may want to compare whether a certain color, format, or design attribute generated more gaze across a product set. A shopper insights team may want to understand which category generated the highest fixation duration and whether that attention changed across different participant segments.
These are not just object-level questions. They are business questions.
Object Groups helps teams move from “what happened to this one item?” to “what pattern is emerging across this category?” That shift makes XR analytics more useful for teams that need to connect immersive behaviour data to decisions about merchandising, packaging, training, product design, and spatial layout.
Use Gaze Data for Group-Level Comparisons
Once objects are organized into groups, Cognitive3D shows group-level gaze and fixation metrics. Teams can review total gaze count, total gaze duration, fixation count, and fixation duration across all objects in a group. Group detail pages also include summary metrics such as object count, average gaze or fixation per session, and sessions with gaze or fixation.
This gives teams a faster way to understand which groups received attention across an XR study.
For stakeholders, this also makes results easier to communicate. A report that says one brand received more total gaze duration than another is often more useful than a long list of individual object rows. A merchandising team can quickly compare shelf zones, a product team can compare packaging attributes, and a research team can summarize visual attention patterns across groups without manually rebuilding the analysis outside the platform.
The insight is already closer to the way teams make decisions.
Flexible Categories for Different Study Designs
Every XR study is different, so Object Groups does not lock teams into one fixed structure.
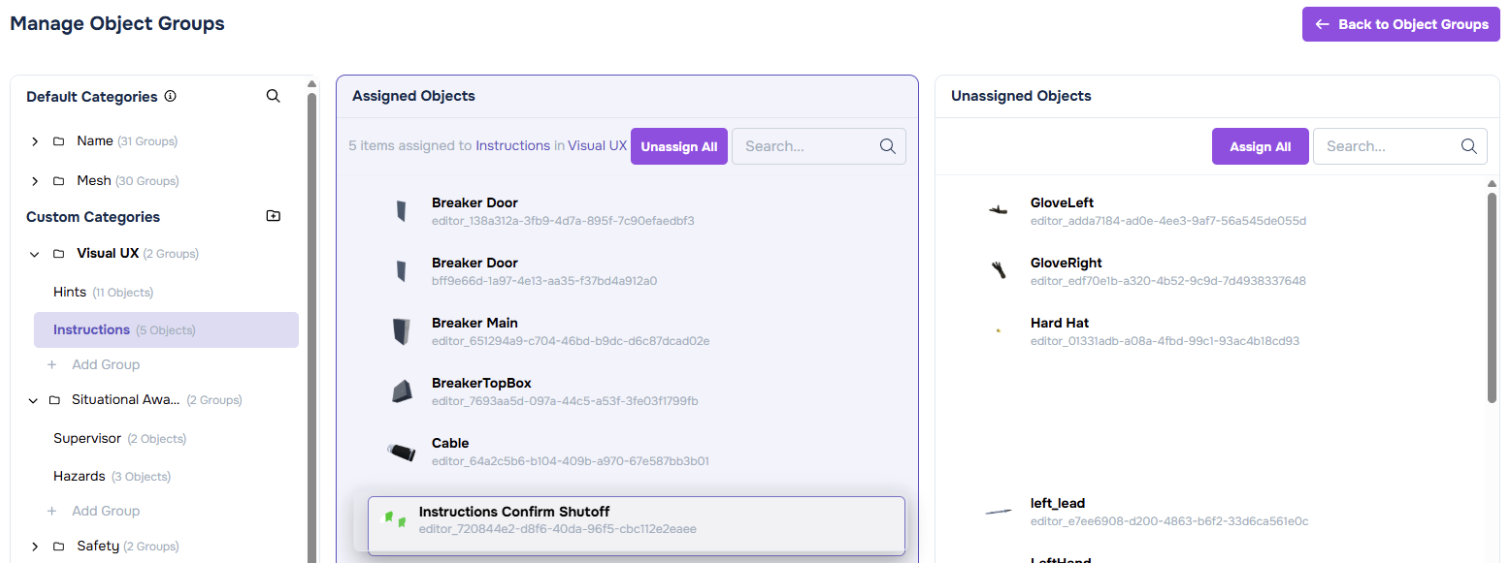
Teams can create custom categories that reflect the way their study is designed. A retail team might group products by brand, placement, or price tier. A CPG team might group products by package format, flavor, size, or promotional treatment. A training team might group objects by equipment type, task relevance, or safety-critical status. An automotive team might group objects by vehicle variant, dashboard control, interior feature, or trim package. An architecture or design team might group objects by room, fixture type, furniture category, or signage type.
The same feature supports many types of XR analytics because the categories are defined by the team, not imposed by the system.
This flexibility is especially useful when a single immersive scene supports more than one research question. A team can use the same data to explore multiple views of object performance. They can look at brand-level attention first, then shift to shelf placement, then compare packaging attributes, all without rebuilding the scene or recollecting data.
Object Groups can also start from default groups based on object name and mesh, helping teams begin with a usable structure before refining it for their study.
Faster Reporting without Losing Export Flexibility
Object Groups brings more of the analysis directly into Cognitive3D, but it still supports external reporting workflows.
Teams can export group-level results by category as CSV files for deeper analysis, BI workflows, stakeholder reports, or presentation development. Exports follow the same session filters used in the dashboard, including tags, date range, and test-mode constraints, so the downloaded data stays aligned with the view being analyzed.
That means teams can answer more questions in the product while still keeping their existing reporting and analysis workflows connected.
For research teams, this reduces the time spent preparing the data before the real analysis begins. For customer insights and merchandising teams, it makes it easier to move from XR gaze tracking and fixation data to a clear recommendation. For analysts using business intelligence tools, it provides a cleaner handoff from Cognitive3D into the broader reporting stack.
The result is a more practical workflow: faster insight in the dashboard, with exportable data available when teams need deeper analysis.
Turn Virtual Shelves into Shopper Insights
Retail and CPG studies are one of the clearest use cases for Object Groups.
In a virtual shelf study, teams often want to understand how product categories perform, not just whether one individual SKU was seen. They need to compare how shoppers respond to brands, placements, packaging variations, price points, promotional treatments, and other product attributes.
Object Groups gives those teams a direct way to analyze attention at the category level.
This deeper analysis can support questions such as whether eye-level placement increases attention, whether a brand block is more noticeable than scattered placement, or whether certain packaging attributes help products stand out on the shelf.
For retail merchandising, shopper behaviour research, and CPG product testing, this creates a faster path from XR attention data to practical insight. Teams can evaluate product placement, compare packaging strategies, and understand what shoppers notice in a realistic immersive environment before making decisions in physical retail spaces.
Ready for any Object-Rich XR Study
While retail is the clearest place to start, Object Groups is not limited to retail studies.
Any XR experience with multiple dynamic objects can benefit from group-level comparison. Training teams can use Object Groups to compare attention across equipment types, tools, safety zones, or task-critical objects. This can help learning and development teams understand whether trainees are looking at the right items during a procedure or whether important equipment is being overlooked.
Automotive teams can use Object Groups to compare attention across vehicle variants, interior features, dashboard controls, infotainment areas, or safety indicators. This can help product and UX teams understand which features draw attention, which areas are ignored, and how design changes influence visual behaviour.
Architecture, design, and simulation teams can group objects by furniture category, fixture type, signage, room section, or environmental feature. This makes it easier to study how people navigate immersive spaces, what they notice, and which elements shape the experience.
Across these use cases, the value is the same. Object Groups helps teams turn many individual object interactions into a clearer view of how categories perform across XR sessions.
Turn Gaze and Fixation Data into Clearer Decisions
Object-level data is valuable, but many important decisions happen one level higher.
Teams do not only need to know whether a single object was seen. They need to know which category performed better, which placement strategy worked, which product group attracted attention, and which attributes influenced user behaviour.
Object Groups helps Cognitive3D customers answer those questions faster by turning object-level gaze and fixation data into clear group-level comparisons.
For teams using XR analytics, eye tracking, gaze tracking, virtual shelf testing, retail merchandising research, CPG product testing, training simulations, or product placement studies, Object Groups creates a more direct path from immersive behaviour data to actionable insight.
It can help teams understand what captures attention, compare performance across categories, and make better decisions based on how people actually behave inside XR.
Contact Cognitive3D to learn more about Object Groups and how category-level XR analytics can support your next study.
Ready To See Inside Your XR App?
Start capturing real user behaviour, app activity, and device inputs in full 3D.