What 290 Million Minutes of XR Data Reveal About Building Better Immersive Experiences


At AWE USA 2026, Cognitive3D’s Head of Data Science, Dr. Nicola Anderson, shared what more than 290 million minutes of recorded XR sessions can teach us about building better immersive experiences.
This data represents more than 550 years of time spent in XR, spanning training, healthcare, gaming, education, enterprise applications, and research. While every application has its own goals and audience, Nicola’s talk highlighted something surprisingly consistent: many of the challenges developers face appear across every industry. Whether users are learning, collaborating, or playing, the same patterns emerge when you have enough behavioural data to see them.
In this article, we’ve summarized three of the biggest takeaways from Nicola’s presentation. The full talk is embedded below if you’d like to watch it from start to finish.
Looking Beyond Traditional Analytics
One of the central ideas in Nicola’s presentation was that XR experiences can’t be understood through traditional analytics alone.
Conventional analytics are excellent at showing what happened. They can tell you how long users stayed in an experience, where they dropped off, or whether they completed a particular objective. Those metrics are valuable, but they rarely explain why users behaved that way.
XR is different because every interaction happens within a three-dimensional space. Movement, gaze, physical comfort, controller input, environmental layout, and application performance all influence the experience. Looking at events alone often leaves out the context that explains user behaviour.
This is why XR analytics combine behavioural data with spatial context. Instead of simply knowing that someone left after four minutes, teams can understand where they were, what they were trying to accomplish, what they looked at, how they moved through the environment, and whether something in the experience contributed to that decision.
Across more than 290 million minutes of recorded sessions, Nicola showed that the following three themes appear again and again.
1. Comfort should be something you can measure
One of the first stories Nicola shared involved a developer preparing to launch a new social VR application. Early testing revealed a concerning trend: nearly 75% of users were ending their sessions within the first five minutes. From a traditional analytics perspective, nothing obvious appeared to be wrong. The application was performing well, and the standard metrics didn’t point to a clear cause.
The answer only became apparent after spending time inside the experience. Even experienced VR users began feeling uncomfortable after several minutes, suggesting that cybersickness, not application performance, was driving users away.
The challenge wasn’t recognizing that something felt wrong, it was finding a reliable way to measure it.
As Nicola explained, this problem ultimately led to the development of Cognitive3D’s Cyberwellness Score, which draws on established research into VR comfort and cybersickness. Rather than relying solely on surveys or subjective feedback, developers can monitor measurable indicators of comfort throughout an experience and evaluate how design decisions influence them over time.
For XR teams, that’s an important shift. Instead of debating whether one version “feels better” than another, comfort becomes another aspect of the experience that can be observed, measured, and improved before launch.
2. The first two minutes often determine whether users stay
Another pattern that appeared repeatedly across Cognitive3D’s dataset was how much influence the opening moments of an experience have on long-term engagement.
Many users decide whether to continue within the first couple of minutes. Some early exits are unavoidable, but Nicola demonstrated that onboarding design plays a much larger role than many teams expect.
One development team was divided over how new users should begin their experience. One group believed users should first learn movement mechanics before progressing, while another argued that users should be placed into meaningful interactions as quickly as possible.
Rather than relying on opinion, the team turned the question into an A/B test. Using Cognitive3D’s remote variables, they tested multiple onboarding experiences directly from the dashboard, allowing them to change which version users received without shipping a new build. That made it possible to iterate quickly, measure the results in real time, and confidently identify the stronger experience.
The data quickly revealed a clear winner. The version that introduced users to meaningful interaction immediately produced significantly stronger engagement. Onboarding completion increased from 40% to 60%, users voluntarily spent approximately four additional minutes in the application, returned sooner for future sessions, and were twice as likely to reach a third session.
The lesson extends well beyond games. Whether you’re building enterprise training, healthcare simulations, or educational applications, the first few minutes establish expectations for everything that follows. Measuring those early interactions provides an opportunity to improve retention before assumptions become accepted design decisions.
3. Spatial problems require spatial analytics
The final example from Nicola’s presentation demonstrated one of the biggest differences between XR analytics and traditional product analytics.
A development team had created a three-part immersive experience, but analytics showed that very few users progressed beyond the first section. The data confirmed that users weren’t reaching the next objective, but it couldn’t explain why.
Once the experience was instrumented with Cognitive3D, the answer became obvious.
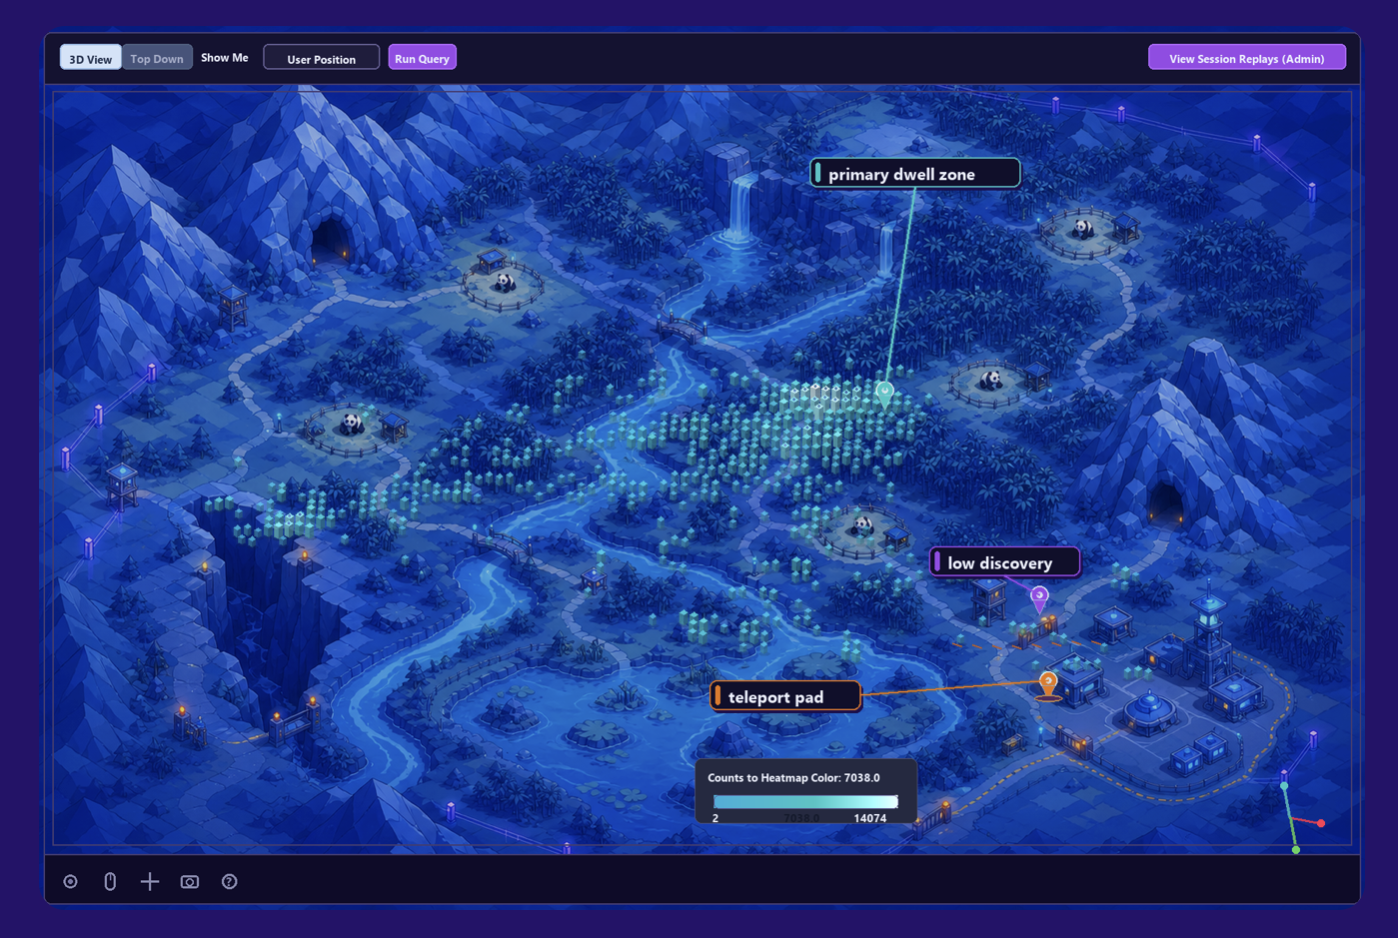
Users weren’t abandoning the application. They were simply spending far longer than expected near the starting area. A spatial aggregation of user movement revealed a dense cluster around the spawn point, while the teleport location leading to the next section sat partially hidden behind terrain that users interpreted as inaccessible.
The solution was remarkably simple. By moving the teleport location to a more visible position, users naturally continued through the experience and completion rates improved.
It’s a simple story, but it illustrates an important point. Traditional analytics might tell you that users never reached the next objective. Spatial analytics reveal where they stopped, how they moved through the environment, and what prevented them from progressing. That additional context often turns a difficult investigation into an obvious design improvement.
What 290 Million Minutes Tell Us About XR
Although each example Nicola presented came from a different application, they all point toward the same conclusion: understanding behaviour in XR requires more than tracking events or measuring session duration.
Comfort can be measured instead of guessed. Onboarding decisions can be validated with behavioural data instead of opinion. Spatial design issues become much easier to identify when you can see how people actually move through an environment.
Perhaps the most interesting takeaway from the presentation is that these weren’t isolated observations. They emerged repeatedly across hundreds of millions of minutes of real user behaviour, making them patterns worth paying attention to regardless of what type of immersive experience you’re building.
If you haven’t had a chance to watch Nicola’s presentation yet, it’s well worth the 27 minutes. The examples provide an excellent look at how behavioural data can help XR teams answer questions that traditional analytics often can’t.
If you’re interested in applying the same approach to your own applications, you can explore the Cognitive3D SDK or book a demo to see how these insights are generated.
Ready To See Inside Your XR App?
Start capturing real user behaviour, app activity, and device inputs in full 3D.