AR and VR Research: From Spatial Data Collection to Meaningful Insights


Connecting Immersive Research, Spatial Data, and Meaningful Insights
AR and VR give researchers something that traditional digital research often cannot: the ability to study behaviour as it happens within a three-dimensional environment.
Instead of only knowing whether someone completed a task or selected an option, XR research can reveal how they got there. Researchers can examine where participants looked, how they moved, what they interacted with, how long different activities took, where mistakes occurred, and what happened throughout an experience.
This creates an especially rich behavioural dataset. But collecting more data is only valuable when researchers and organizations have a reliable way to capture it and, ultimately, understand what it means.
This is where spatial analytics comes in.
Cognitive3D provides the tools to collect behavioural data from XR experiences across a range of development platforms, then turn that information into usable insights through dashboards, spatial visualizations, and 3D Session Replay.
Why AR and VR Research Produces Richer Behavioural Data
Most conventional analytics describe actions through relatively simple events: a page was viewed, a button was clicked, a form was completed. The behaviour inside AR and VR is inherently more spatial.
A participant might walk toward a piece of equipment, look at several controls, hesitate, reach for the wrong object, correct their movement, and eventually complete the task. The final result matters, but so does everything that happened along the way.
This makes AR and VR research especially useful when researchers need to understand behaviour in context.
Movement can help show how people navigate an environment. Gaze and eye tracking can provide insight into visual attention. Interactions can show how participants engage with objects. Events and objectives can capture important milestones, errors, or outcomes. Session and participant properties can provide additional context for comparing results between people or groups.
Together, these signals provide a more complete record of an experience than a single outcome alone.
For academic researchers, that could mean investigating attention, cognition, movement, decision-making, or human-computer interaction. For organizations, it could mean evaluating training performance, validating a simulation, studying a product experience, or identifying where users struggle inside an application.
In every case, the first challenge is the same: how do you reliably capture all of that spatial behaviour?
Collecting XR Research Data Across Development Platforms
XR research is built using many different development tools, devices, and application frameworks. A measurement strategy therefore becomes much more useful when it can work across that ecosystem.
Cognitive3D provides SDKs for Unity, Unreal Engine, WebXR, Apple visionOS, Android XR, and native C++ development, allowing researchers and development teams to incorporate spatial analytics into the technologies they already use.
Whether a team is focused on XR development with Unity, building an Unreal Engine simulation, creating a browser-based WebXR study, or developing for newer spatial computing platforms, behavioural data can be captured and analyzed through the same Cognitive3D platform.
This allows researchers to consider measurement as part of the experience itself. Teams can determine which interactions are important, which objectives represent successful performance, which events need to be recorded, and what participant or session information will be useful during analysis.
A cross-platform approach is particularly valuable as XR research programs grow. Different studies, teams, or applications may use different development environments, but the organization does not need to completely rethink how XR behaviour is measured each time. Cognitive3D provides a consistent analytics layer across those experiences, making it easier to collect and compare spatial data as research expands across platforms and devices.
From Spatial Data Collection to Data Visualization
Once XR data has been captured, the focus shifts to understanding what it reveals.
A research session can generate movement data, gaze, fixations, object interactions, custom events, objectives, sensor information, session properties, and other measurements. Across many participants and sessions, that can quickly become a substantial dataset.
Researchers still need a way to answer the important question: what is this data telling us?
This is where data visualization in VR and XR analytics becomes critical.
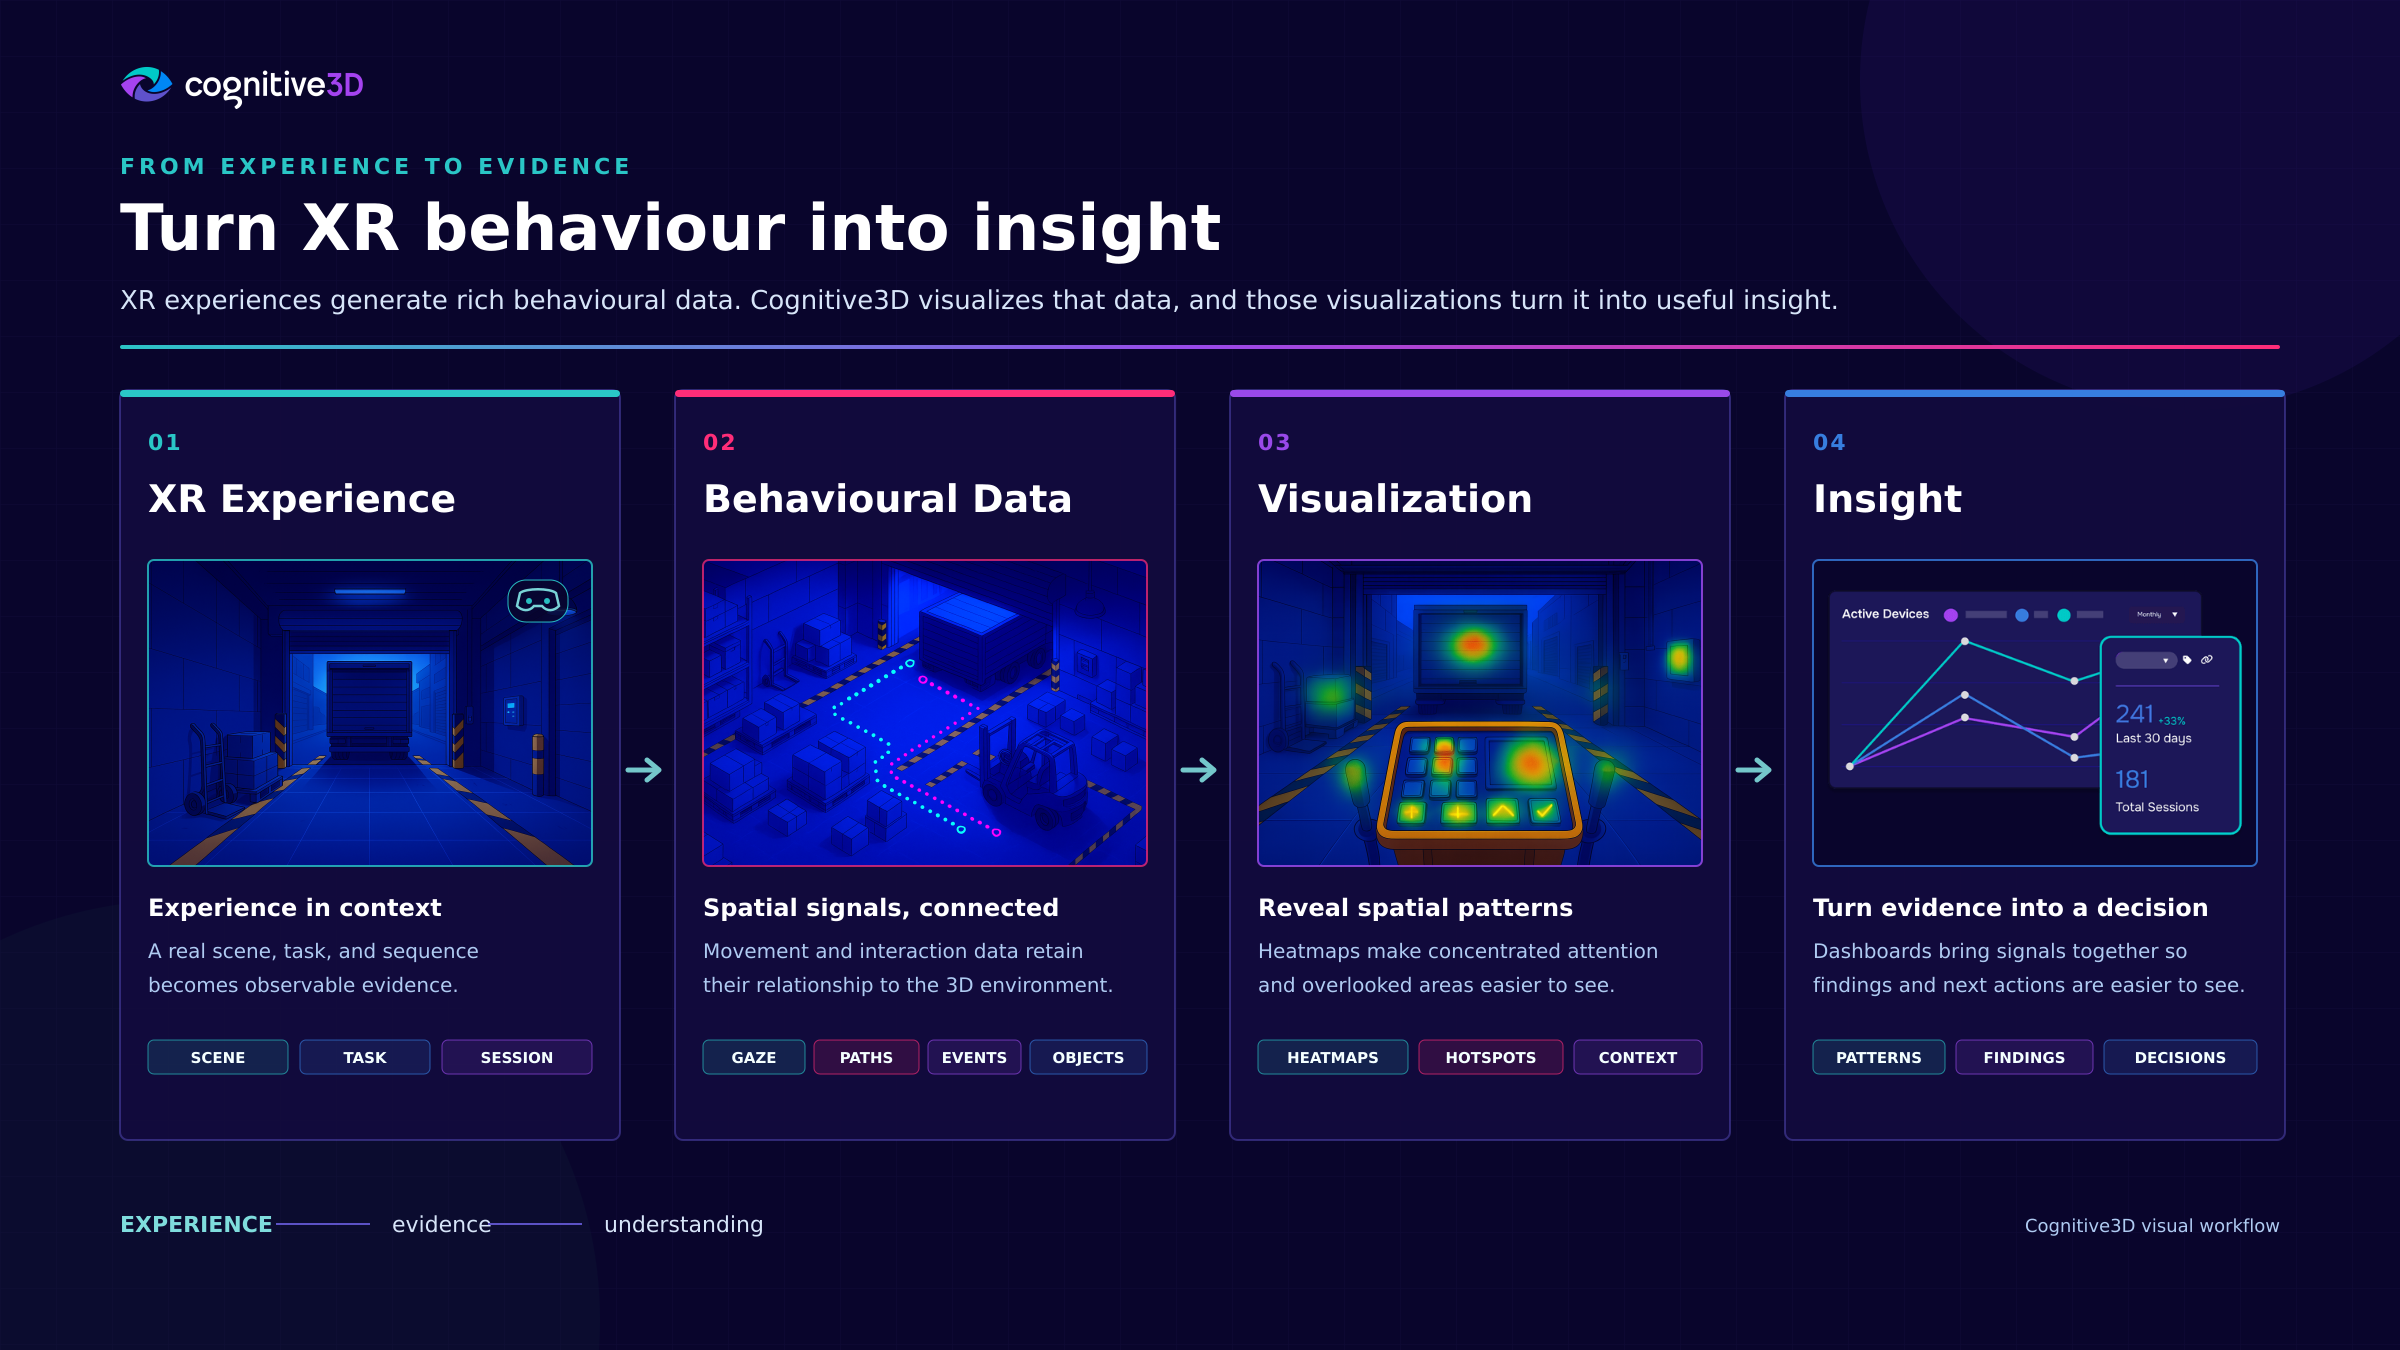
Cognitive3D’s dashboards turn collected session data into metrics and visualizations that make patterns easier to investigate. Teams can look at individual sessions or step back and evaluate results across a larger group of participants.
The dashboards provide different views depending on the question being asked. Researchers can examine project-level metrics, sessions, participants, objectives, events, dynamic objects, and other captured information, while filtering and segmenting data to investigate particular groups or conditions.
Instead of working only with raw telemetry, researchers gain a structured way to explore what happened across a study. This makes it easier to move from simply collecting XR data to identifying patterns within it.
Seeing XR Behaviour Through Session Replay
Some research questions cannot be fully answered by a chart. Knowing that a participant took longer to complete a task is useful. Seeing what they were doing during those additional seconds can be even more revealing.
Cognitive3D’s Session Replay reconstructs an individual participant’s session within the 3D environment, allowing researchers to review what happened as the experience unfolded. Recorded information such as gaze and fixations, paths, dynamic objects, events, controllers, and sensor data can be viewed alongside the replay. Researchers can pause the session, move through the timeline, change camera perspectives, and investigate particular moments in greater detail.
This allows researchers to see the data within the context of what was actually happening in the XR experience.
Imagine that a training dashboard shows one group taking considerably longer to complete a particular objective. The metric identifies the difference, and Session Replay can help researchers investigate why.
Were participants looking in the wrong place? Did they approach the wrong object? Was there hesitation before an interaction? Did they repeatedly move between two areas? Was an important visual cue being missed?
The dashboard reveals the pattern, and Session Replay helps explain the behaviour behind it.
Connecting Individual Behaviour With Research-Level Patterns
This combination of aggregate analytics and individual session analysis is particularly powerful for XR research.
Researchers rarely want to understand only one participant. They want to identify patterns across a population and determine whether different conditions, designs, or interventions produce meaningful differences.
At the same time, aggregate results can hide important context. Cognitive3D allows teams to move between those two perspectives.
A researcher might first use a dashboard to compare objective completion, interactions, attention, or another outcome across participants. After identifying an interesting result, they can investigate relevant individual sessions more closely through Session Replay.
The reverse is also possible. Something unusual noticed during an individual replay can become a new question to investigate across the larger dataset. This creates a much more useful relationship between quantitative results and spatial behaviour.
Instead of treating an XR session as either a spreadsheet of measurements or a video to review manually, researchers can use both structured analytics and a reconstructed view of the experience to understand what occurred.
Making XR Research Data Useful Beyond the Research Team
The same approach also makes spatial data more useful across an organization.
A data scientist may want access to detailed measurements. A researcher may want to compare participant groups. A developer may need to investigate a particular interaction. A training leader may care about whether people are successfully completing a procedure. An executive may simply want evidence that an XR initiative is producing the intended outcome.
Not everyone is technically inclined and needs to work directly with raw XR telemetry.
Dashboards make broader patterns easier to communicate, while Session Replay gives teams an intuitive way to see behaviour within the experience itself. When deeper analysis is required, Cognitive3D also provides ways to export collected data for further analysis.
This means the same underlying spatial dataset can support different levels of investigation across research, development, data science, and business teams.
From XR Experience to Research Insight
AR and VR research creates an opportunity to understand human behaviour in ways that are difficult to achieve with conventional digital analytics, but realizing that opportunity requires more than simply building an immersive experience.
First, researchers need to capture the rich behavioural data that XR makes possible.
Cognitive3D helps collect that data across Unity, Unreal Engine, WebXR, visionOS, Android XR, and C++, allowing spatial analytics to become part of a wide range of XR development workflows.
The next step is turning that collected data into insights researchers and organizations can easily interpret and use.
Cognitive3D dashboards help researchers identify patterns across participants and sessions, while Session Replay brings those results back into the spatial context of the original experience.
Whether the goal is academic research, immersive training, usability testing, healthcare simulation, consumer research, or another XR application, the value comes from being able to understand not just whether something happened, but how, where, and why it happened.
That is what turns XR data into evidence that researchers and organizations can actually use.
Want to see what spatial analytics could reveal about your XR research? Book a demo with Cognitive3D.