Track Stability Over Time: Monitor XR App Performance Across Every Release


What Happens When XR Performance Goes Unmonitored
XR applications are becoming larger, more complex, and more critical to business outcomes. Whether you’re building immersive training programs, enterprise simulations, product experiences, or research environments, performance issues can quickly undermine user confidence and project success.
The challenge is that XR performance problems rarely appear in obvious ways. A framerate drop might only affect a single scene, a crash may occur on one headset model but nowhere else, battery drain may increase after a release without triggering alerts during QA testing. By the time users report problems, valuable time has already been lost investigating, reproducing, and diagnosing issues.
To maintain high-quality XR experiences, teams need visibility beyond individual sessions. They need to understand how application performance changes across scenes, versions, devices, and time.
This is why aggregate XR performance monitoring has become a critical part of successful XR development and operations.
Why XR Performance Becomes Harder to Manage as Applications Grow
Early in development, performance monitoring is relatively straightforward. Teams can test scenes directly, profile hardware, and evaluate performance in controlled environments.
As applications scale, however, performance becomes significantly more difficult to manage.
Multiple headset types will introduce hardware variability, new releases introduce unforeseen regressions, additional content can increase rendering complexity, and larger user populations can create more diverse usage patterns than internal testing can ever replicate.
The result is that performance issues often emerge in production environments long before developers are aware of them.
Without visibility across the entire XR program, teams struggle to answer fundamental questions:
- Which scenes are causing instability?
- Are crashes increasing after a recent release?
- Which devices experience the most performance issues?
- Are optimization efforts actually improving performance?
- Is the application stable enough for wider deployment?
Answering these questions requires more than logs and isolated debugging sessions. It requires a system for monitoring performance trends across the entire XR experience.
Monitor Performance Across Scenes, Versions, and Devices
Understanding XR application health requires visibility across the variables that influence performance most. For most teams, those variables are scenes, software versions, and hardware platforms.
Looking at any one of these dimensions in isolation provides an incomplete picture. Together, they reveal how application stability evolves over time.
Compare Performance by Scene
Every XR environment behaves differently.
A lightweight onboarding scene may perform flawlessly, while a detailed training simulation filled with interactive objects, complex lighting, and dynamic systems may place significant demands on the device.
Without scene-level monitoring, performance issues often appear random. Users report stuttering or instability, but developers have little context for identifying where problems originate.
Monitoring performance across scenes allows teams to understand exactly how each environment contributes to overall application health.
Developers can compare framerate stability, CPU usage, GPU load, battery consumption, and crash frequency between scenes to quickly identify high-risk areas. If a particular environment consistently generates performance issues, it becomes immediately visible through aggregate analysis.
This visibility transforms optimization efforts from guesswork into targeted action. Instead of investigating every possible cause, teams can focus on the scenes that create the greatest impact on user experience.
As XR applications continue to evolve, scene-level performance monitoring helps ensure that new content, features, and updates do not introduce hidden stability problems.
Track Stability Across App Versions
Every new release carries risk. New assets, workflows, interactions, and platform updates can all affect performance in unexpected ways. Even seemingly minor changes may introduce regressions that only become visible after deployment.
Traditional QA testing is valuable, but it rarely reflects the scale and diversity of real-world usage. Users interact with applications differently than testers, often revealing issues that never appeared during internal validation.
Tracking performance across app versions provides an objective way to evaluate release quality.
Teams can compare framerate trends, crash rates, battery consumption, and hardware performance between builds to determine whether stability is improving or declining over time. Performance changes that might otherwise go unnoticed become immediately apparent when viewed across hundreds or thousands of sessions.
This evidence helps development teams validate optimization work, identify regressions earlier, and make more informed decisions about rollout readiness.
Instead of relying on assumptions or anecdotal feedback, teams can measure exactly how each release performs in production.
Understand Device-Specific Behaviour
XR performance is heavily influenced by hardware.
Different headsets vary in processing power, thermal limits, operating systems, battery capacity, memory availability, and tracking capabilities. As a result, an experience that performs well on one device may behave very differently on another.
This variability creates significant challenges for QA and deployment teams.
A problem affecting only one headset model may remain invisible during testing if that hardware is not adequately represented. Similarly, performance issues tied to operating system versions or device configurations may be difficult to reproduce consistently.
Monitoring performance by device helps uncover these patterns before they become larger problems.
Teams can compare stability across headset models, identify hardware-specific crash trends, evaluate battery performance differences, and understand which devices require additional optimization attention.
For organizations deploying XR applications across enterprise fleets, this visibility becomes particularly valuable. Rather than treating all devices equally, teams gain a clearer understanding of how experiences perform in the environments where users actually spend their time.
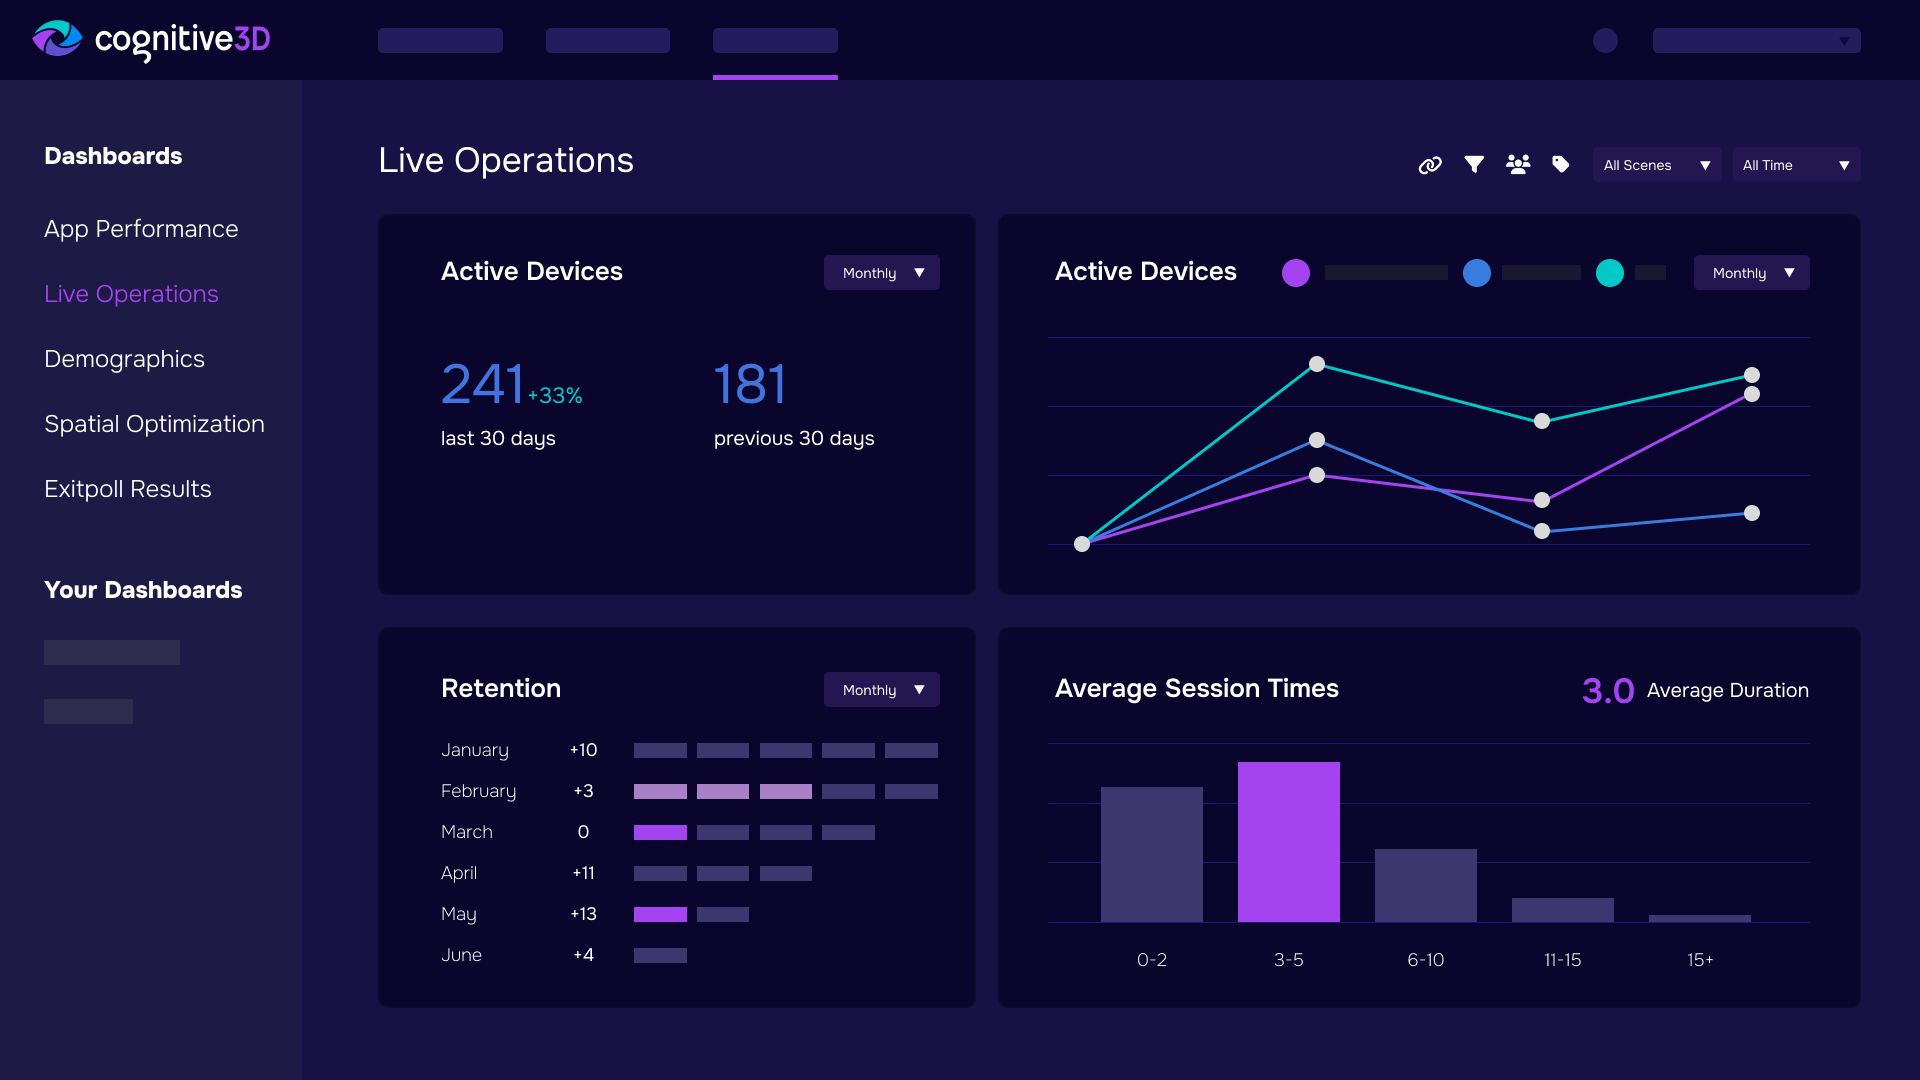
Visualize Framerate and Stability Trends
Framerate is one of the most important indicators of XR experience quality.
Unlike traditional applications, XR experiences rely on consistent rendering performance to maintain immersion, comfort, and usability. Even brief drops below target refresh rates can negatively affect user perception and increase the likelihood of discomfort.
The challenge is that average framerate metrics rarely tell the whole story.
An application may appear healthy when viewed through aggregate averages while still experiencing significant instability during specific scenes, interactions, or environmental conditions.
Visualizing framerate trends over time provides a much deeper understanding of performance behavior.
Teams can identify where performance falls below target thresholds, compare stability between releases, and monitor long-term trends across devices and environments. Rather than reviewing isolated data points, they gain visibility into how application performance evolves across the entire XR program.
Heatmaps make it easy to identify locations associated with performance degradation, while timeline overlays provide additional context by showing exactly when drops occur during a session.
Together, these tools help teams move beyond simply measuring performance and begin understanding the conditions that cause instability.
Detect Crashes Before They Become Widespread
Crashes remain one of the most disruptive issues users encounter in XR.
Unfortunately, they are also among the most difficult problems to reproduce. Many crashes occur only under specific combinations of hardware, software versions, environmental conditions, or user behaviours.
As a result, developers often spend significant time trying to recreate issues before meaningful investigation can begin.
Aggregate crash monitoring helps eliminate this uncertainty.
By tracking crash activity across scenes, versions, devices, and sessions, teams can identify emerging patterns much earlier in the development lifecycle. Issues that might appear isolated at first become easier to recognize when viewed across a larger population of users.
Developers can quickly determine whether crashes are concentrated within a specific scene, introduced by a recent release, or isolated to a particular device type.
This visibility shortens troubleshooting cycles and allows teams to prioritize fixes based on real-world impact rather than assumptions.
Instead of reacting to support tickets, teams can proactively address stability issues before they affect larger user populations.
Monitor CPU, GPU, Memory, and Battery Performance
Performance issues are rarely caused by a single metric.
Framerate degradation may be driven by GPU bottlenecks. Battery drain may result from excessive processing demands. Thermal throttling may reduce application responsiveness over time. Memory constraints may contribute to instability and crashes.
Understanding XR application health requires visibility into all of these systems simultaneously.
Monitoring CPU utilization, GPU load, memory usage, battery consumption, and related metrics provides a more complete picture of application performance.
Teams can identify resource-intensive workflows, evaluate how new features affect hardware utilization, and determine whether optimization efforts are producing meaningful improvements.
This broader context allows developers to diagnose root causes more effectively and prioritize improvements that have the greatest impact on user experience.
Rather than chasing symptoms, teams gain the information needed to address the underlying sources of instability.
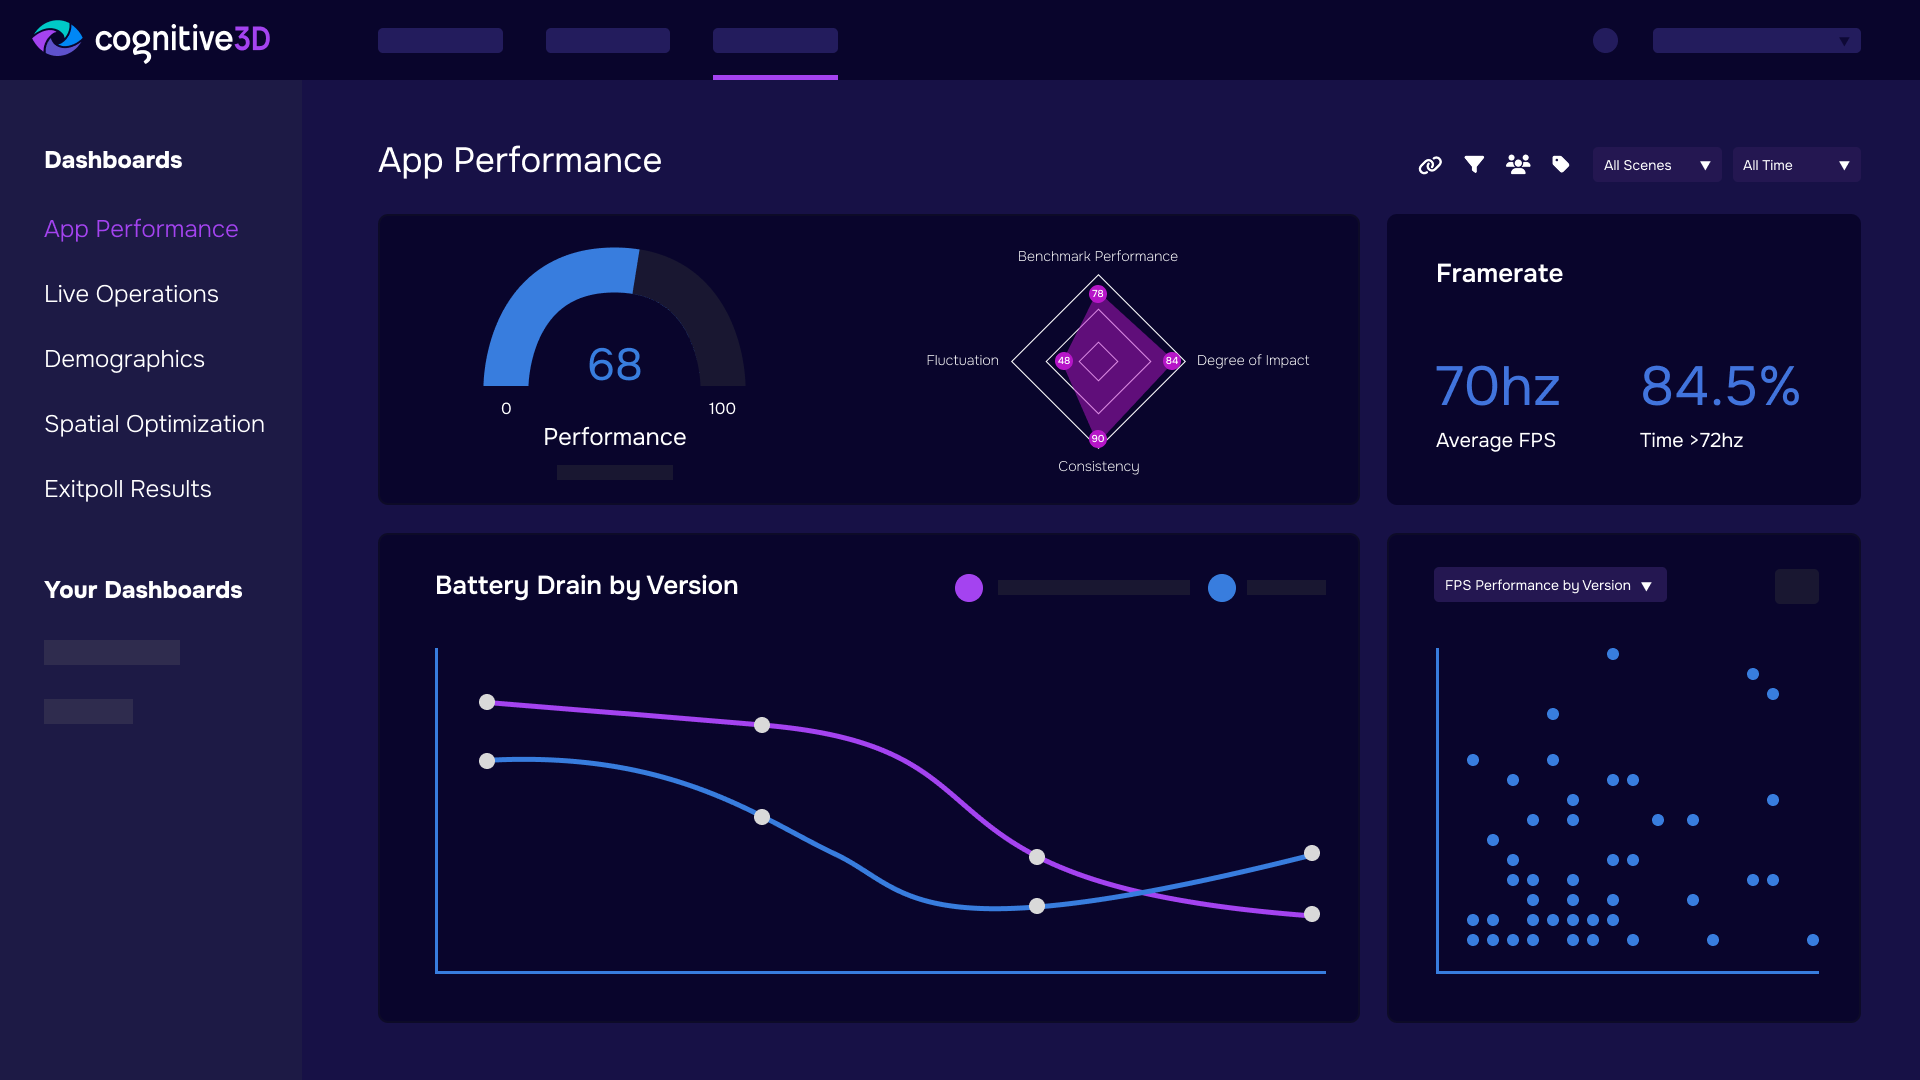
Use Heatmaps and Timeline Overlays to Identify Bottlenecks Faster
Raw performance metrics are valuable, but they often lack context.
A sudden framerate drop tells developers that something happened. It does not necessarily explain where it occurred, what users were doing, or which conditions contributed to the issue.
Visualization bridges this gap.
Performance heatmaps reveal where bottlenecks emerge within XR environments, helping teams understand which areas generate the greatest system load. Timeline overlays synchronize performance metrics with session activity, allowing analysts to connect system behaviour directly to user actions and application events.
This combination provides a significantly richer understanding of performance issues.
Developers can investigate specific moments, identify environmental factors contributing to instability, and quickly isolate areas requiring optimization.
Instead of manually reviewing logs or attempting to reproduce issues repeatedly, teams gain visual evidence that accelerates diagnosis and resolution.
Validate Publishing Readiness with Confidence
One of the most difficult decisions in XR development is determining whether an application is truly ready for broader deployment. Internal testing can provide confidence, but production readiness requires evidence from real-world usage patterns.
Aggregate performance monitoring provides that evidence.
By comparing stability across scenes, versions, sessions, and devices, teams can evaluate whether an application consistently delivers the experience users expect. Performance trends become measurable, optimization efforts become verifiable, and release decisions become more objective.
Rather than relying on intuition, organizations can use actual performance data to guide rollout, testing, and publishing decisions.
This creates a more predictable path to deployment while reducing the risk of introducing performance issues into production environments.
Build Better XR Experiences Through Continuous Performance Visibility
Performance monitoring is about more than finding bugs, it is about understanding how XR experiences behave as they evolve.
As applications grow, new content is introduced, and user populations expand, maintaining visibility into performance becomes increasingly important. Teams that understand how stability changes over time are better positioned to deliver reliable, comfortable, and scalable XR experiences.
By monitoring framerate, crashes, CPU and GPU load, memory consumption, battery drain, and device-specific behaviour across sessions, organizations gain a clearer understanding of overall application health.
The result is faster troubleshooting, more informed optimization decisions, greater release confidence, and ultimately better XR experiences for every user.
Because when performance trends are visible, teams can stop reacting to problems and start improving experiences proactively.
The best XR experiences are built on continuous performance insight. Book a personalized demo to see how Cognitive3D helps development teams uncover hidden performance issues, validate release readiness, and optimize XR experiences using real-world performance data.
Ready To See Inside Your XR App?
Start capturing real user behaviour, app activity, and device inputs in full 3D.