Organization Dashboard: Monitor XR Performance Across Every Project in One Place


A Unified View of XR Performance Across the Organization
As XR programs expand across teams, locations, and applications, the operational questions start to change.
At the beginning of an XR deployment, teams usually focus on what is happening inside a single project. They review sessions, replay participant behaviour, evaluate objectives, and monitor application performance within one deployment at a time. But once XR becomes part of a larger organizational initiative, project-level visibility is no longer enough.
As XR programs expand across teams, locations, and deployments, the operational challenges become harder to ignore. Program owners need a clear view of adoption across the organization, operations teams need to identify which deployments are active and which may be underperforming, support teams need faster ways to locate participants across multiple projects, and stakeholders need evidence that the broader XR initiative is producing measurable outcomes.
The data may already exist, but accessing and comparing it efficiently across projects is where operational friction begins to appear. The Organization Dashboard was built to solve that problem.
This release introduces two new organization-level pages inside Cognitive3D that make it easier to monitor XR programs across multiple deployments from a single operational view.
Instead of treating each project as an isolated environment, organizations can now analyze usage, monitor XR health trends, review outcomes, and locate participants across the entire organization without rebuilding the answer every time.
Why Organization-Level Visibility Matters in XR
One of the biggest operational challenges in enterprise XR is that success is rarely measured inside a single deployment.
Most organizations are running multiple projects simultaneously. Different training programs, research initiatives, onboarding experiences, simulations, or product environments often exist across departments and locations at the same time. As those deployments grow, leadership needs a way to understand the broader program, not just the individual applications inside it.
Without organization-level analytics, even simple questions become surprisingly expensive to answer.
Accessing and comparing data across projects slows down reporting and increases investigation time. It makes it harder to identify adoption trends early and delays support workflows. Most importantly, it makes it more difficult for organizations to prove the effectiveness of XR programs across the business.
Organization Dashboard reduces that friction by bringing organizational oversight directly into the platform.
A Dashboard Designed for XR Programs Operating at Scale
The Organization Dashboard introduces a new analytics surface under the Organization section of the Cognitive3D dashboard, available on Pro plans and above.
The dashboard is designed to answer the operational questions that emerge once XR expands beyond a single project.
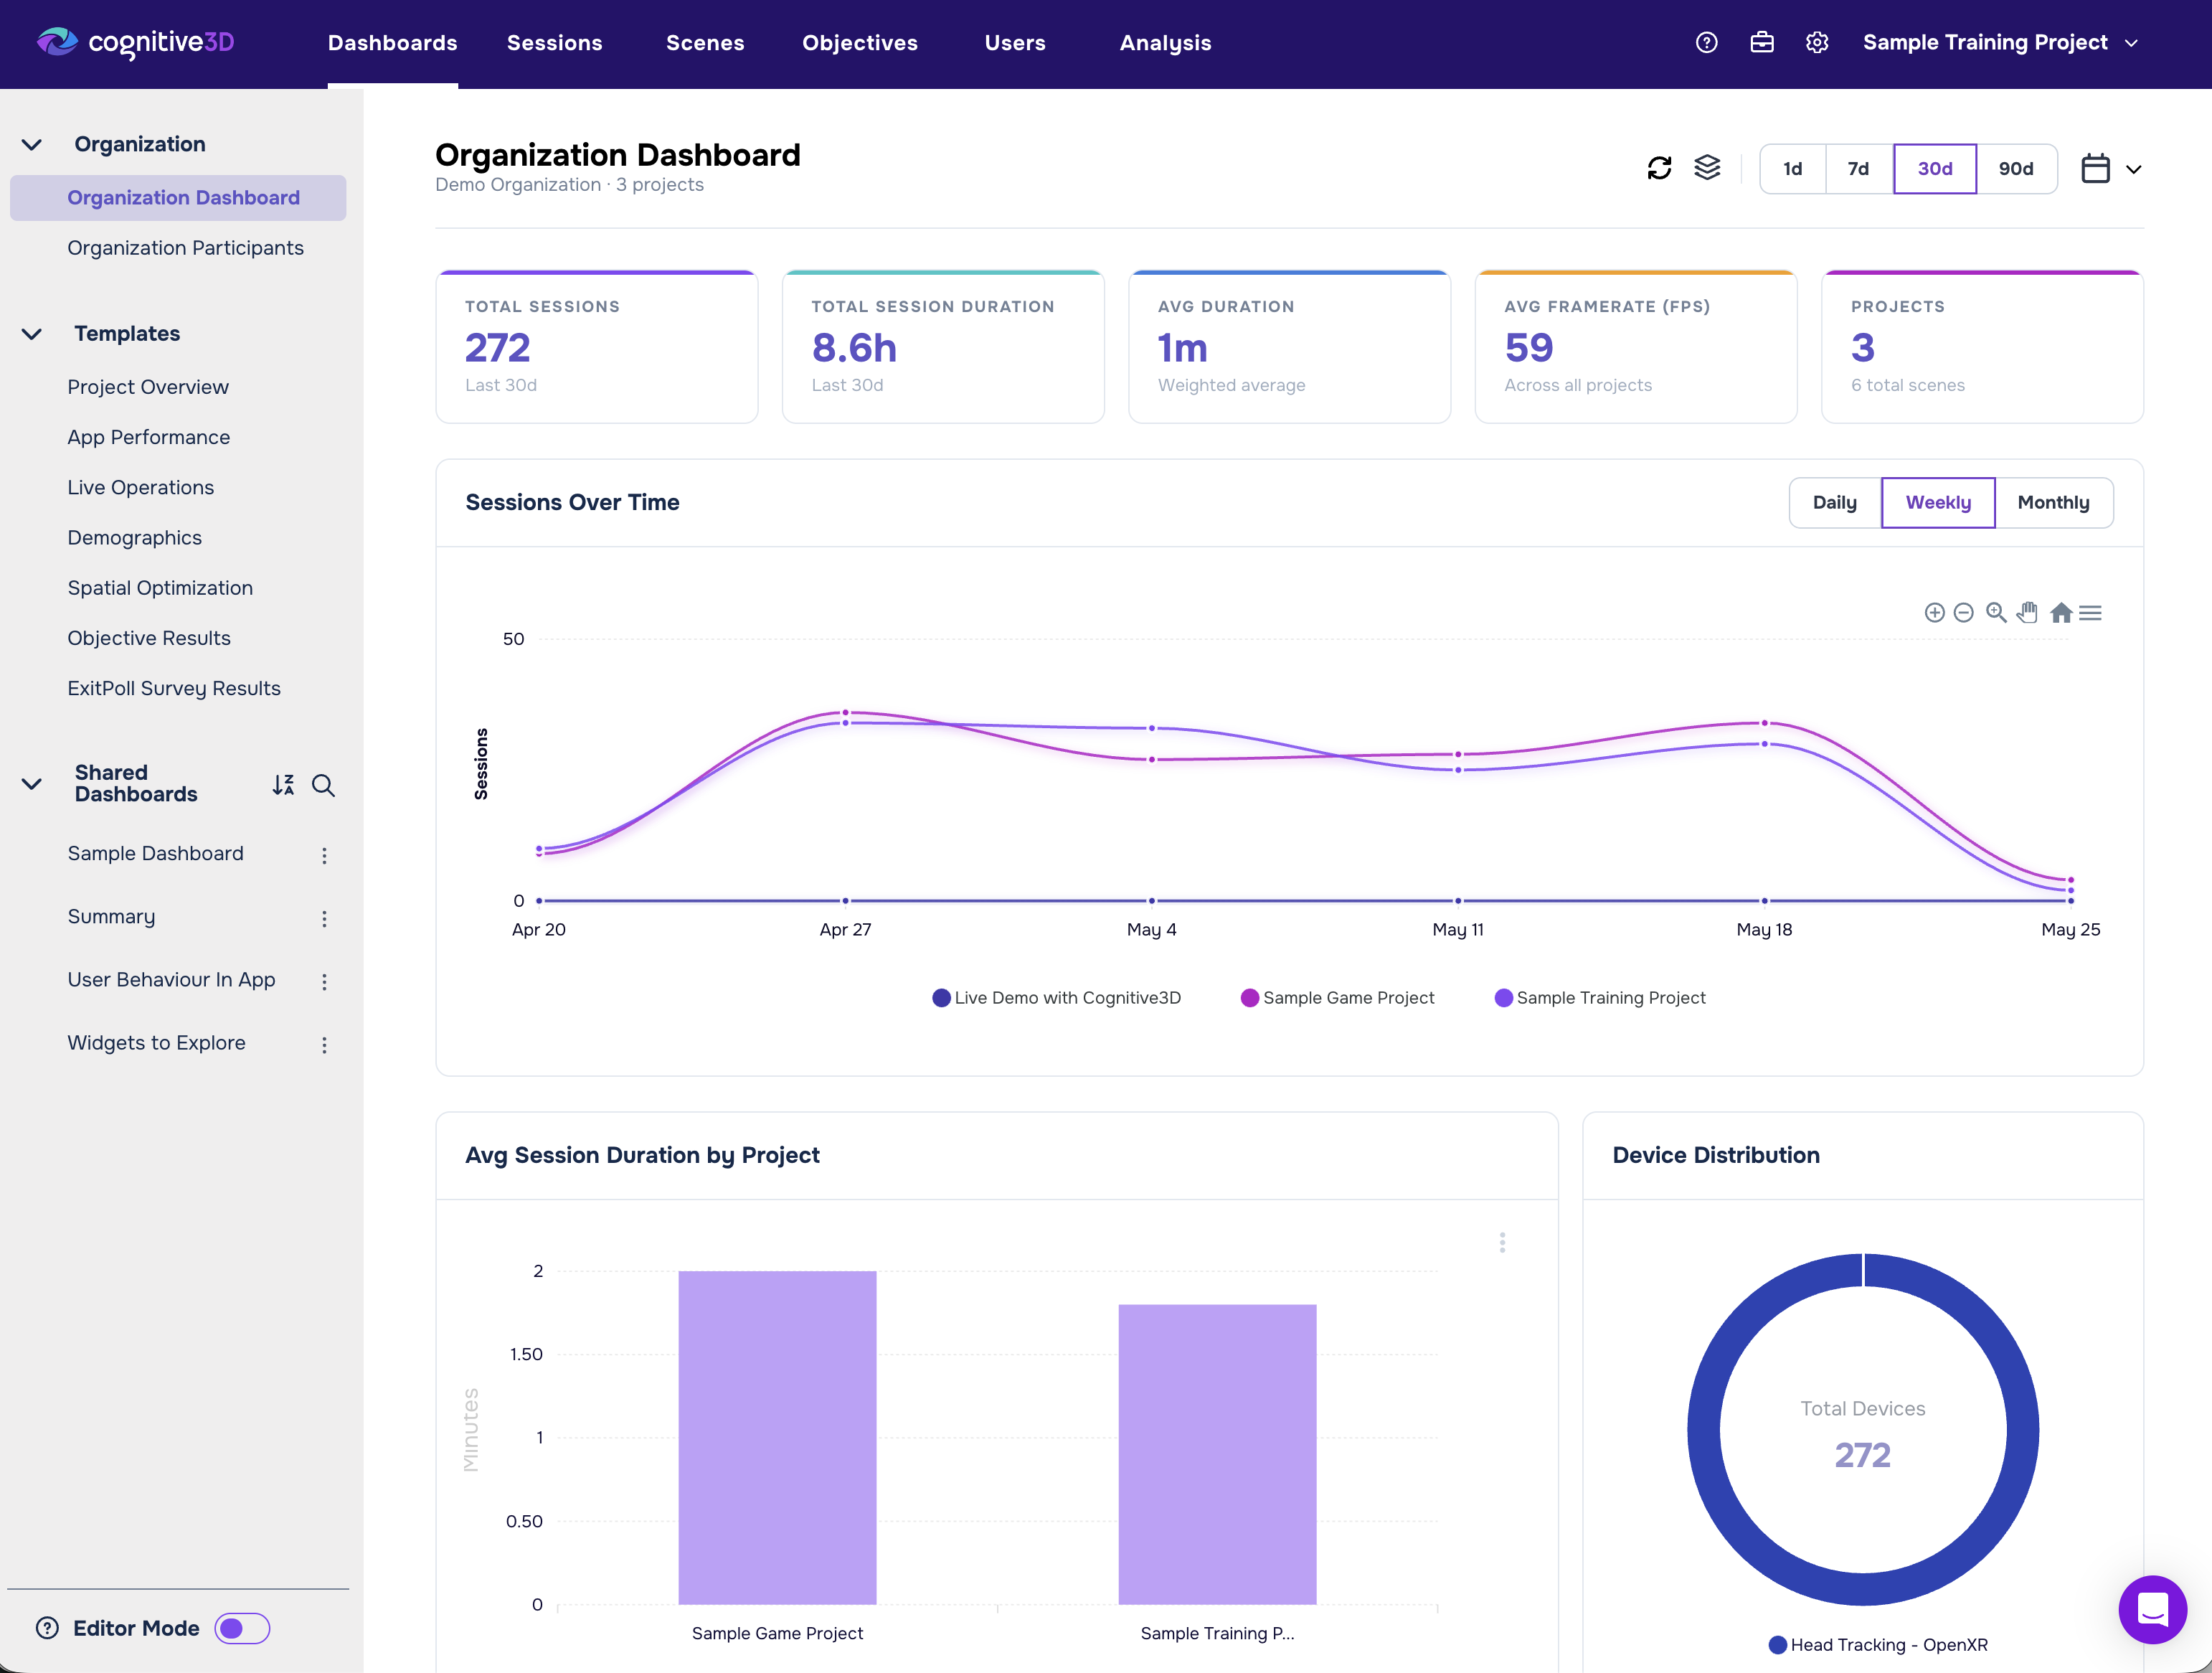
At the top level, teams can immediately review organization-wide KPIs including total sessions, total duration, average session duration, and active project count. These metrics provide a fast operational read on the scale and pace of XR activity across the organization.
That visibility matters because organizations often struggle to quantify adoption consistently across deployments. Instead of manually aggregating project data, stakeholders can now see overall usage trends from one location. For teams responsible for reporting ROI internally, that creates a much clearer operational picture of how XR is being used across the organization.
Turning XR Activity Into Operational Insight
The dashboard then expands into broader cross-project analytics that help teams move beyond simple usage counts.
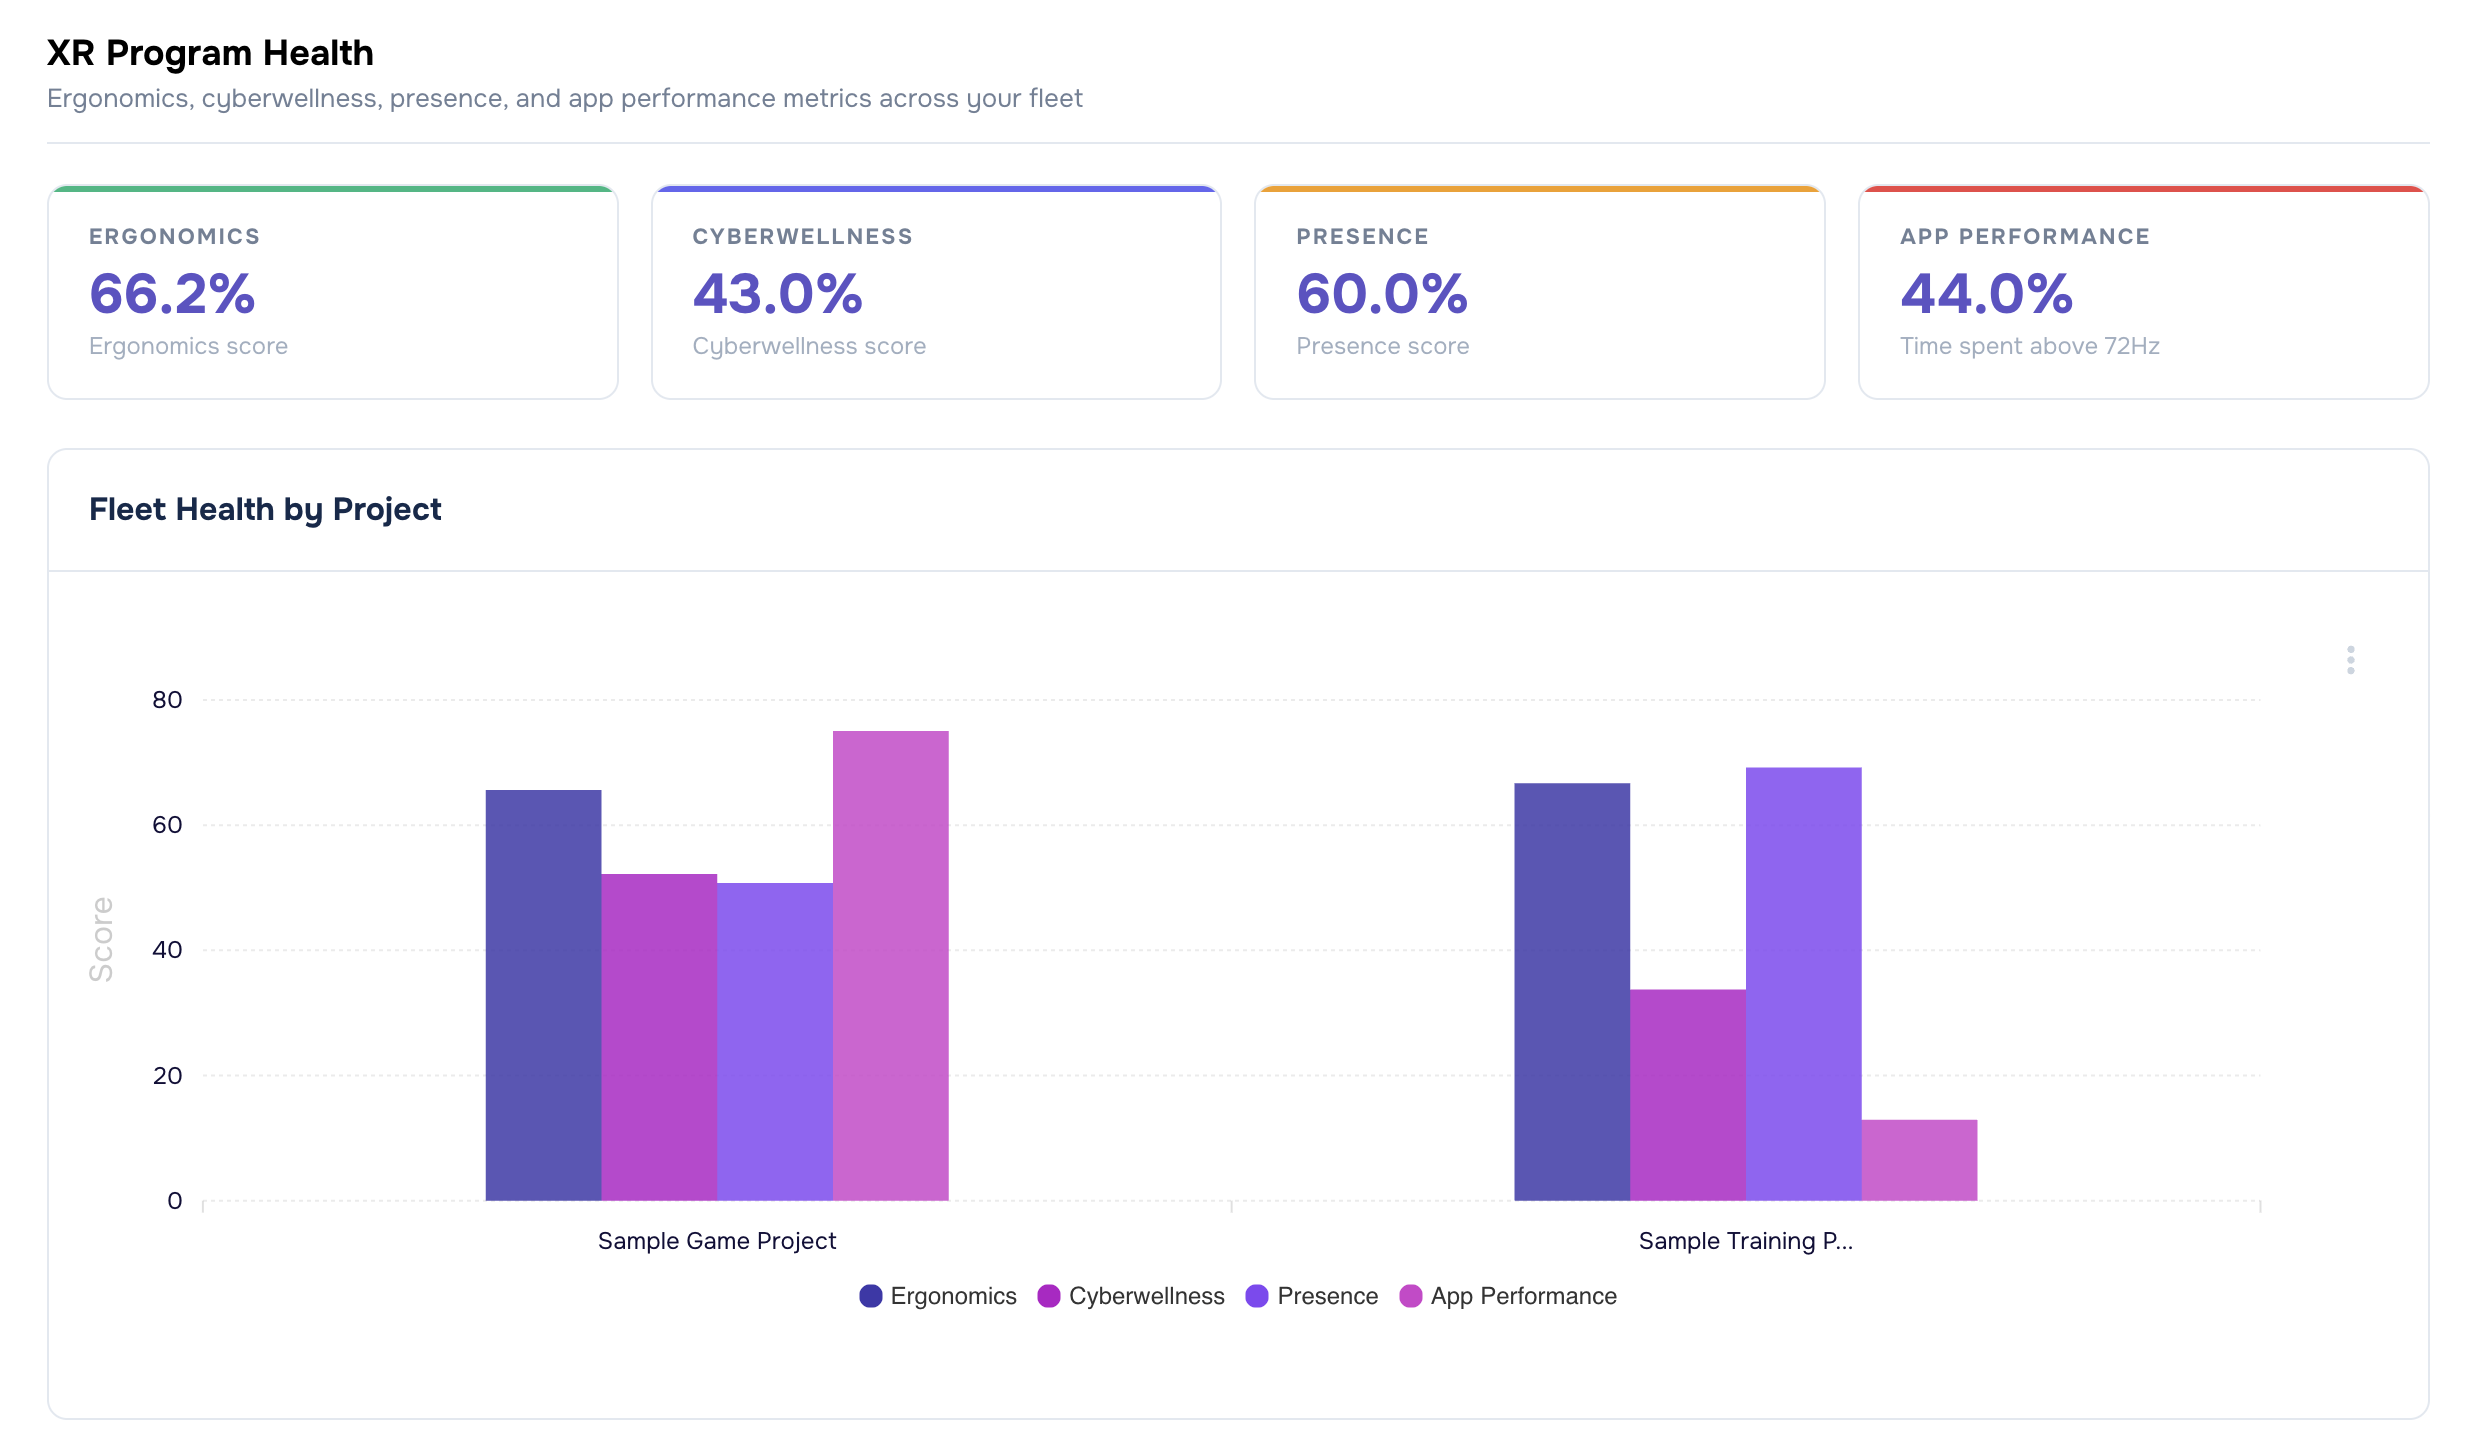
XR Program Health metrics including Ergonomics, Cyberwellness, Presence, and App Performance can now be reviewed across projects with detailed breakdown charts for each deployment. This makes it easier to identify trends that may otherwise remain hidden inside isolated dashboards. Teams can compare comfort and performance indicators across deployments, identify outliers earlier, and monitor whether changes to applications or training programs are improving the overall XR experience over time.
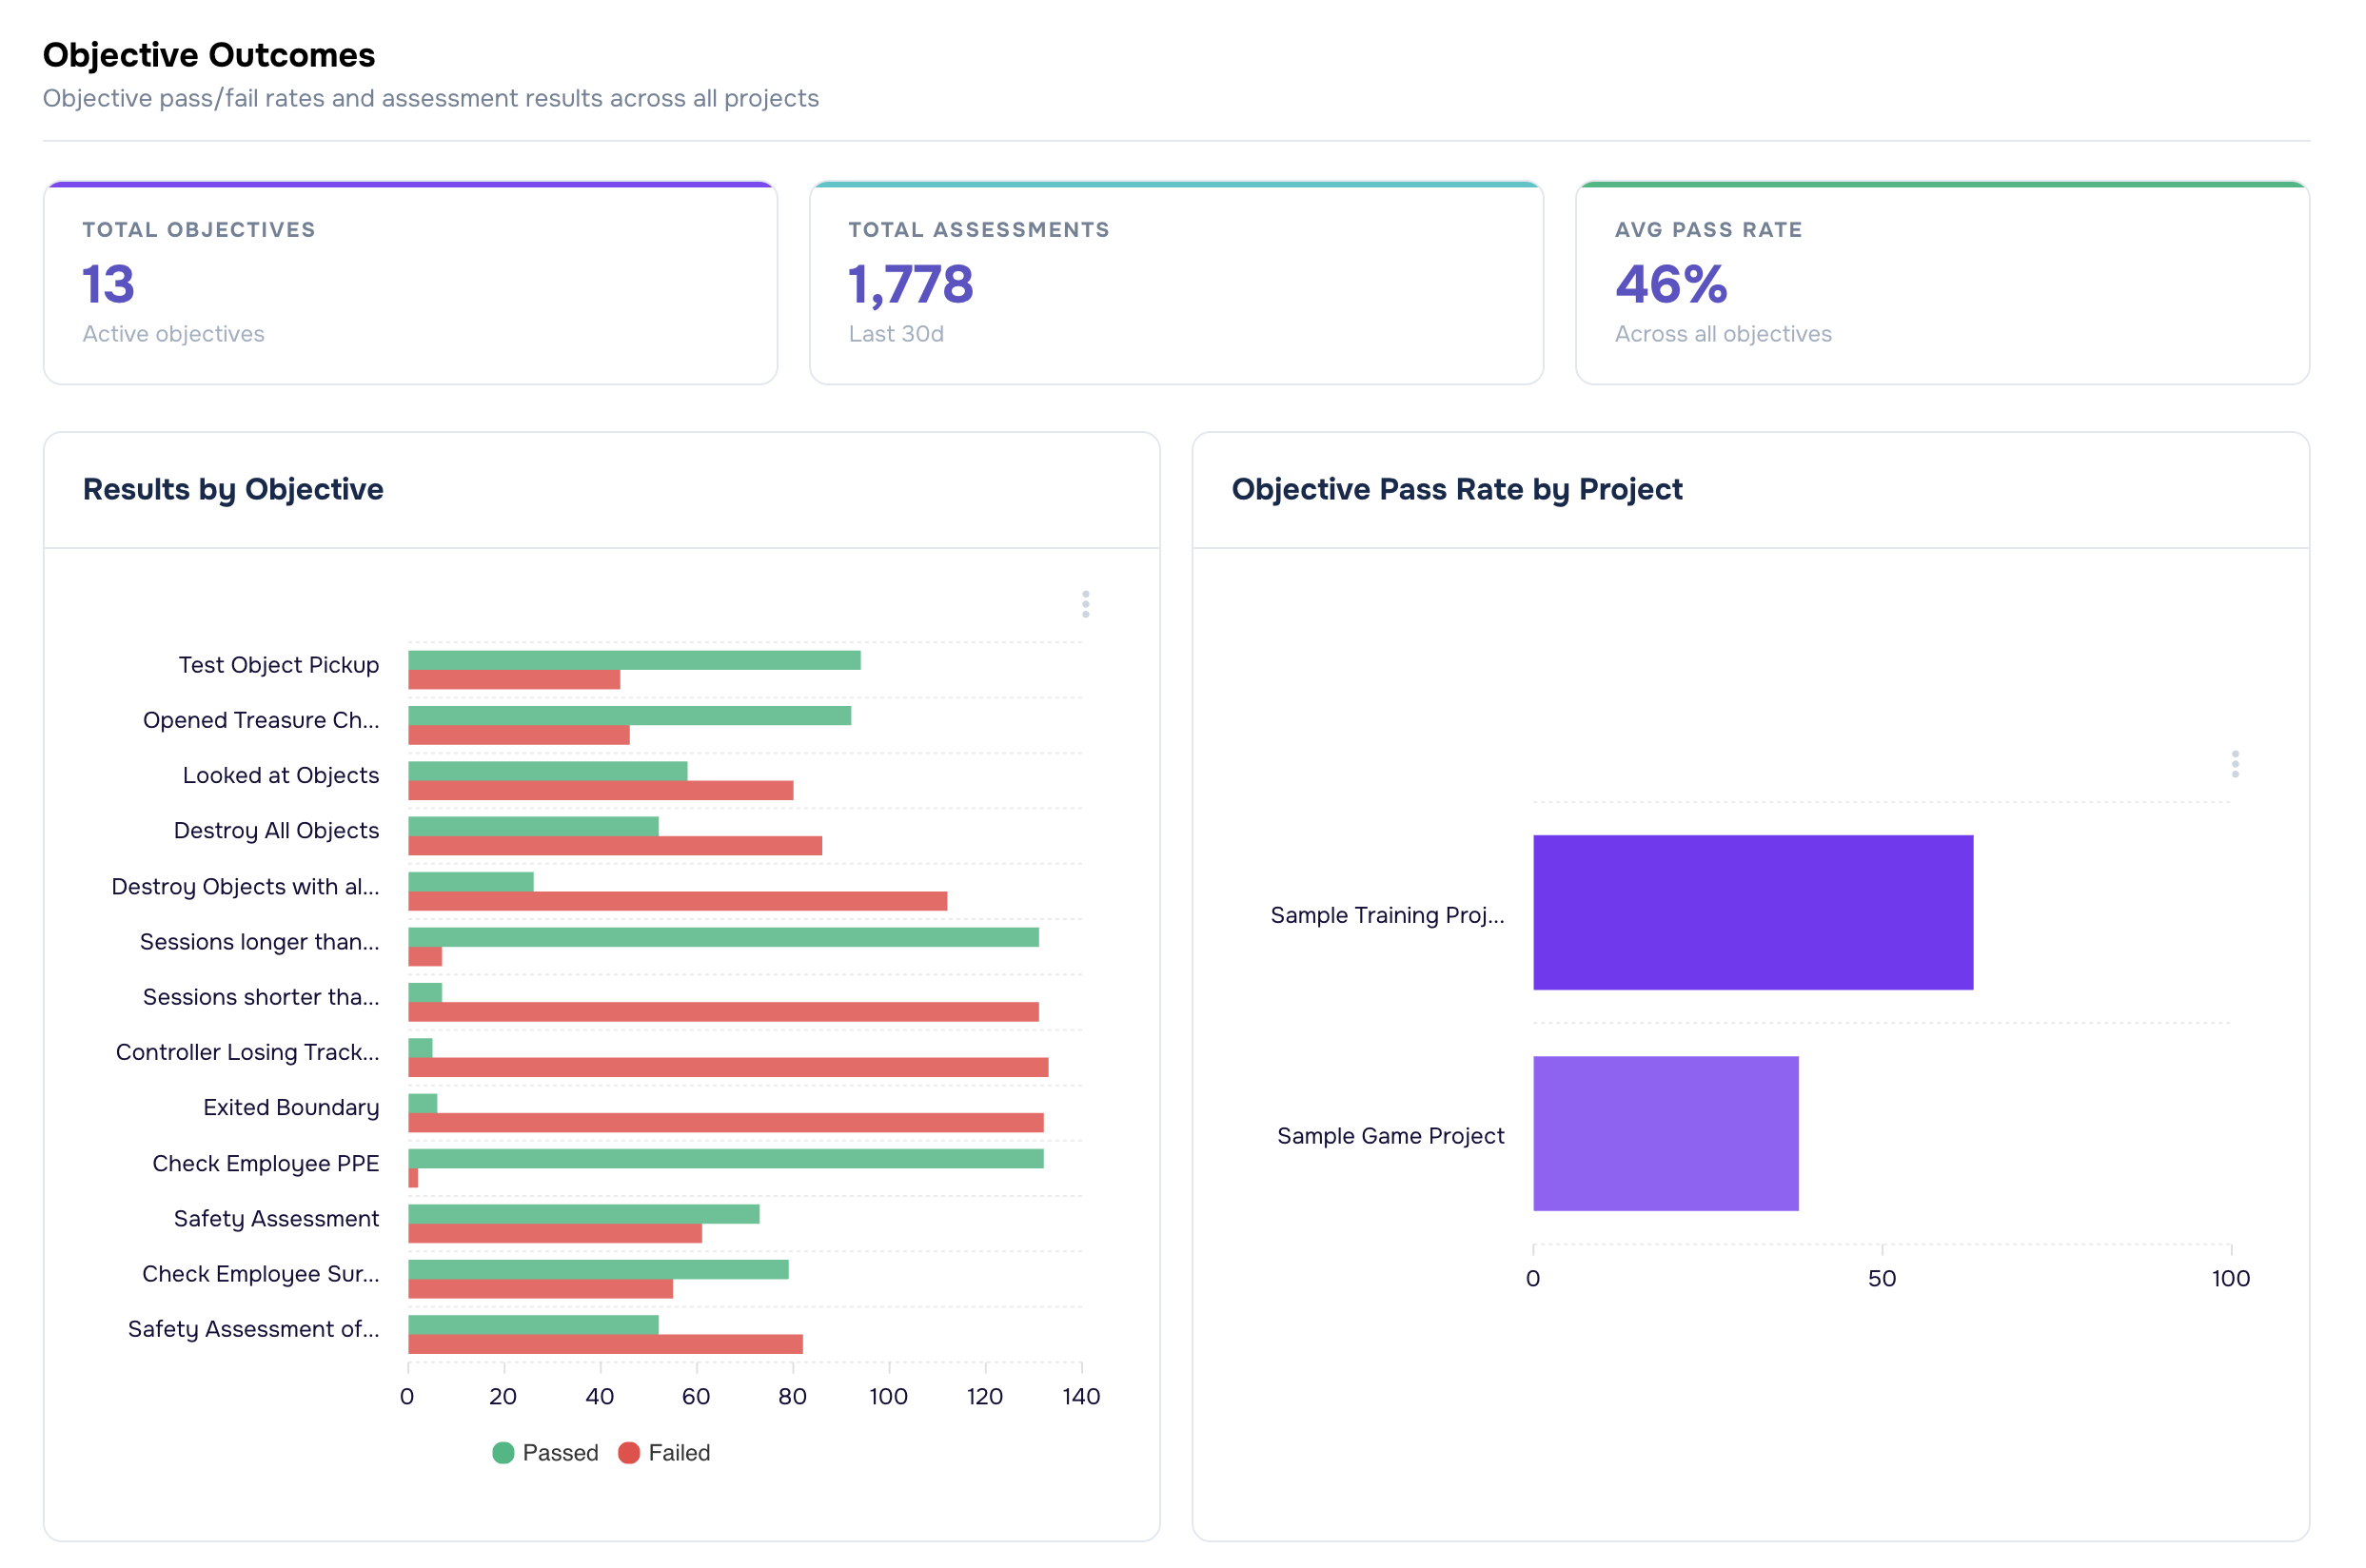
Objective Outcomes provide another important operational layer by showing pass and fail counts alongside project-level pass rates. This allows organizations to move beyond measuring participation alone and start evaluating whether users are successfully completing the experiences being delivered. For enterprise training teams especially, that distinction matters. Session volume may show adoption, but outcome data helps demonstrate effectiveness.
The dashboard also includes geographic session distribution views by country and subdivision. For organizations operating across multiple locations, this makes it easier to understand where XR activity is occurring and how deployments are spreading operationally over time.
Device analytics extend that visibility further by breaking usage down by operating system, device model, and device type. This gives teams a clearer operational understanding of the hardware ecosystem supporting their XR deployments. Instead of relying on assumptions about device usage, teams can now monitor real deployment patterns directly through the dashboard. That can help inform procurement decisions, compatibility planning, support prioritization, and long-term rollout strategy.
Finally, a project breakdown table ties those analytics together with per-project session counts and duration totals, making it easier to understand where aggregate activity is actually coming from.
The result is not simply more analytics. It is a more operationally usable view of XR performance across the organization.
Reducing the Cost of Operational Investigation
One of the largest improvements introduced by the Organization Dashboard is the reduction in manual comparison work.
Previously, investigating trends across deployments often required rebuilding the same analysis repeatedly. Teams needed to open dashboards individually, compare metrics manually, and reconstruct the broader organizational picture through repeated navigation. That process creates hidden operational costs.
Every additional step increases the time required to investigate issues, monitor adoption, or explain program performance internally. As XR programs scale, those inefficiencies compound quickly. The Organization Dashboard shortens that path significantly.
A stakeholder reviewing XR Program Health trends no longer needs to compare projects one by one. A program owner evaluating objective outcomes can now review pass-rate patterns across deployments from a single location. Device adoption trends can be monitored organization-wide instead of reconstructed from isolated project snapshots.
This is important because the operational value of analytics is not just determined by whether the data exists. It is determined by how quickly teams can turn that data into usable decisions.
The faster organizations can identify trends, validate outcomes, investigate issues, and support participants, the easier it becomes to operationalize XR at scale.
Filters Designed for Real Operational Workflows
Broad visibility only becomes useful if teams can narrow the scope when needed.
All Organization Dashboard widgets support flexible filtering controls, including date ranges for one day, seven days, thirty days, ninety days, and custom windows. Teams can also use a project selector to isolate specific deployments without leaving the organization-level view.
That flexibility allows the dashboard to support both executive oversight and day-to-day operational investigation.
An operations lead may start with organization-wide metrics before narrowing the scope to a subset of deployments experiencing lower pass rates; a training team may compare activity during a recent rollout period; or a support team may isolate projects tied to a particular device type or location. The dashboard supports all of these transitions naturally because the workflow no longer depends on repeated project switching.
That reduction in navigational friction may sound small, but at an organizational scale it becomes meaningful. It reduces investigation time, improves reporting efficiency, and makes analytics substantially more usable for teams managing large XR programs.
Cross-Project Participant Visibility in One Place
The second part of the release is Organization Participants.
This page introduces a cross-project Participant Finder that allows teams to search participants across the entire organization using participant ID or participant name.
Results include the participant’s full name when available, user ID, per-project session count, latest session date, and latest objective status with pass or fail results and associated dates. Each result also links directly to the User Details page for the relevant project.
This changes a workflow that previously created significant operational overhead for support and operations teams.
Before Organization Participants, locating someone often depended on already knowing which project to search. If the wrong project was selected first, the search process had to be repeated manually somewhere else.
That approach becomes increasingly inefficient as deployments scale.
Organization Participants reverses that workflow by starting with the person rather than the project. Teams can now search once and immediately identify where a participant exists across the organization, which projects are relevant, and what their recent activity looks like.
For support teams, this reduces investigation time substantially. For operations teams, it creates a faster path to validating participant activity and objective completion. For organizations managing large XR deployments, it removes a significant amount of repetitive manual searching from everyday workflows.
Making XR Oversight Operationally Sustainable
The larger shift behind this release is operational maturity.
As organizations expand XR programs, analytics cannot remain isolated at the project layer. Teams need organization-level visibility to monitor adoption, evaluate outcomes, identify operational issues, and support participants efficiently across deployments.
Organization Dashboard brings that organizational oversight directly into Cognitive3D, and Organization Participants extends the same approach to participant search and operational support workflows.
Together, these additions help organizations spend less time rebuilding visibility manually and more time acting on the insights already available inside their XR data. That is ultimately where the ROI appears.
Not just in collecting more information, but in reducing the operational cost required to understand what is happening across the organization. Faster investigation, clearer reporting, improved oversight, and easier participant management all contribute to making XR programs more scalable and easier to support over time.
For organizations running XR across multiple projects, that operational visibility becomes increasingly important as deployments grow.
To learn more about Organization Dashboard and Organization Participants, contact Cognitive3D.