Introducing Our New Plugin: External Log Monitoring


Introducing Our New Plugin: External Log Monitoring
Ensuring a seamless user experience is paramount, especially in the realms of Augmented Reality (AR), Virtual Reality (VR), and Mixed Reality (MR). Crashes, low memory issues, and other log events can significantly disrupt the user experience and tarnish an app's reputation. To address these challenges, we are excited to introduce our new external logging plugin, designed to monitor and record crash logs and other critical logs, including low memory logs.
Why Log Monitoring Matters?
Crash logs are invaluable for developers, offering insights into the root causes of app failures. In AR/VR/MR applications, where the user experience is deeply immersive, even minor disruptions can be jarring. By analyzing these logs, developers can identify and fix bugs, optimize performance, and ultimately create a smoother and more reliable app experience. However, crash logs are just one piece of the puzzle. Low memory logs and other system events also play a crucial role in understanding app behavior and preventing potential issues before they escalate.
Features of Our Plugin
Our plugin is engineered to provide comprehensive monitoring and logging capabilities, empowering developers with detailed information about their app's performance. Here are some of the key features:
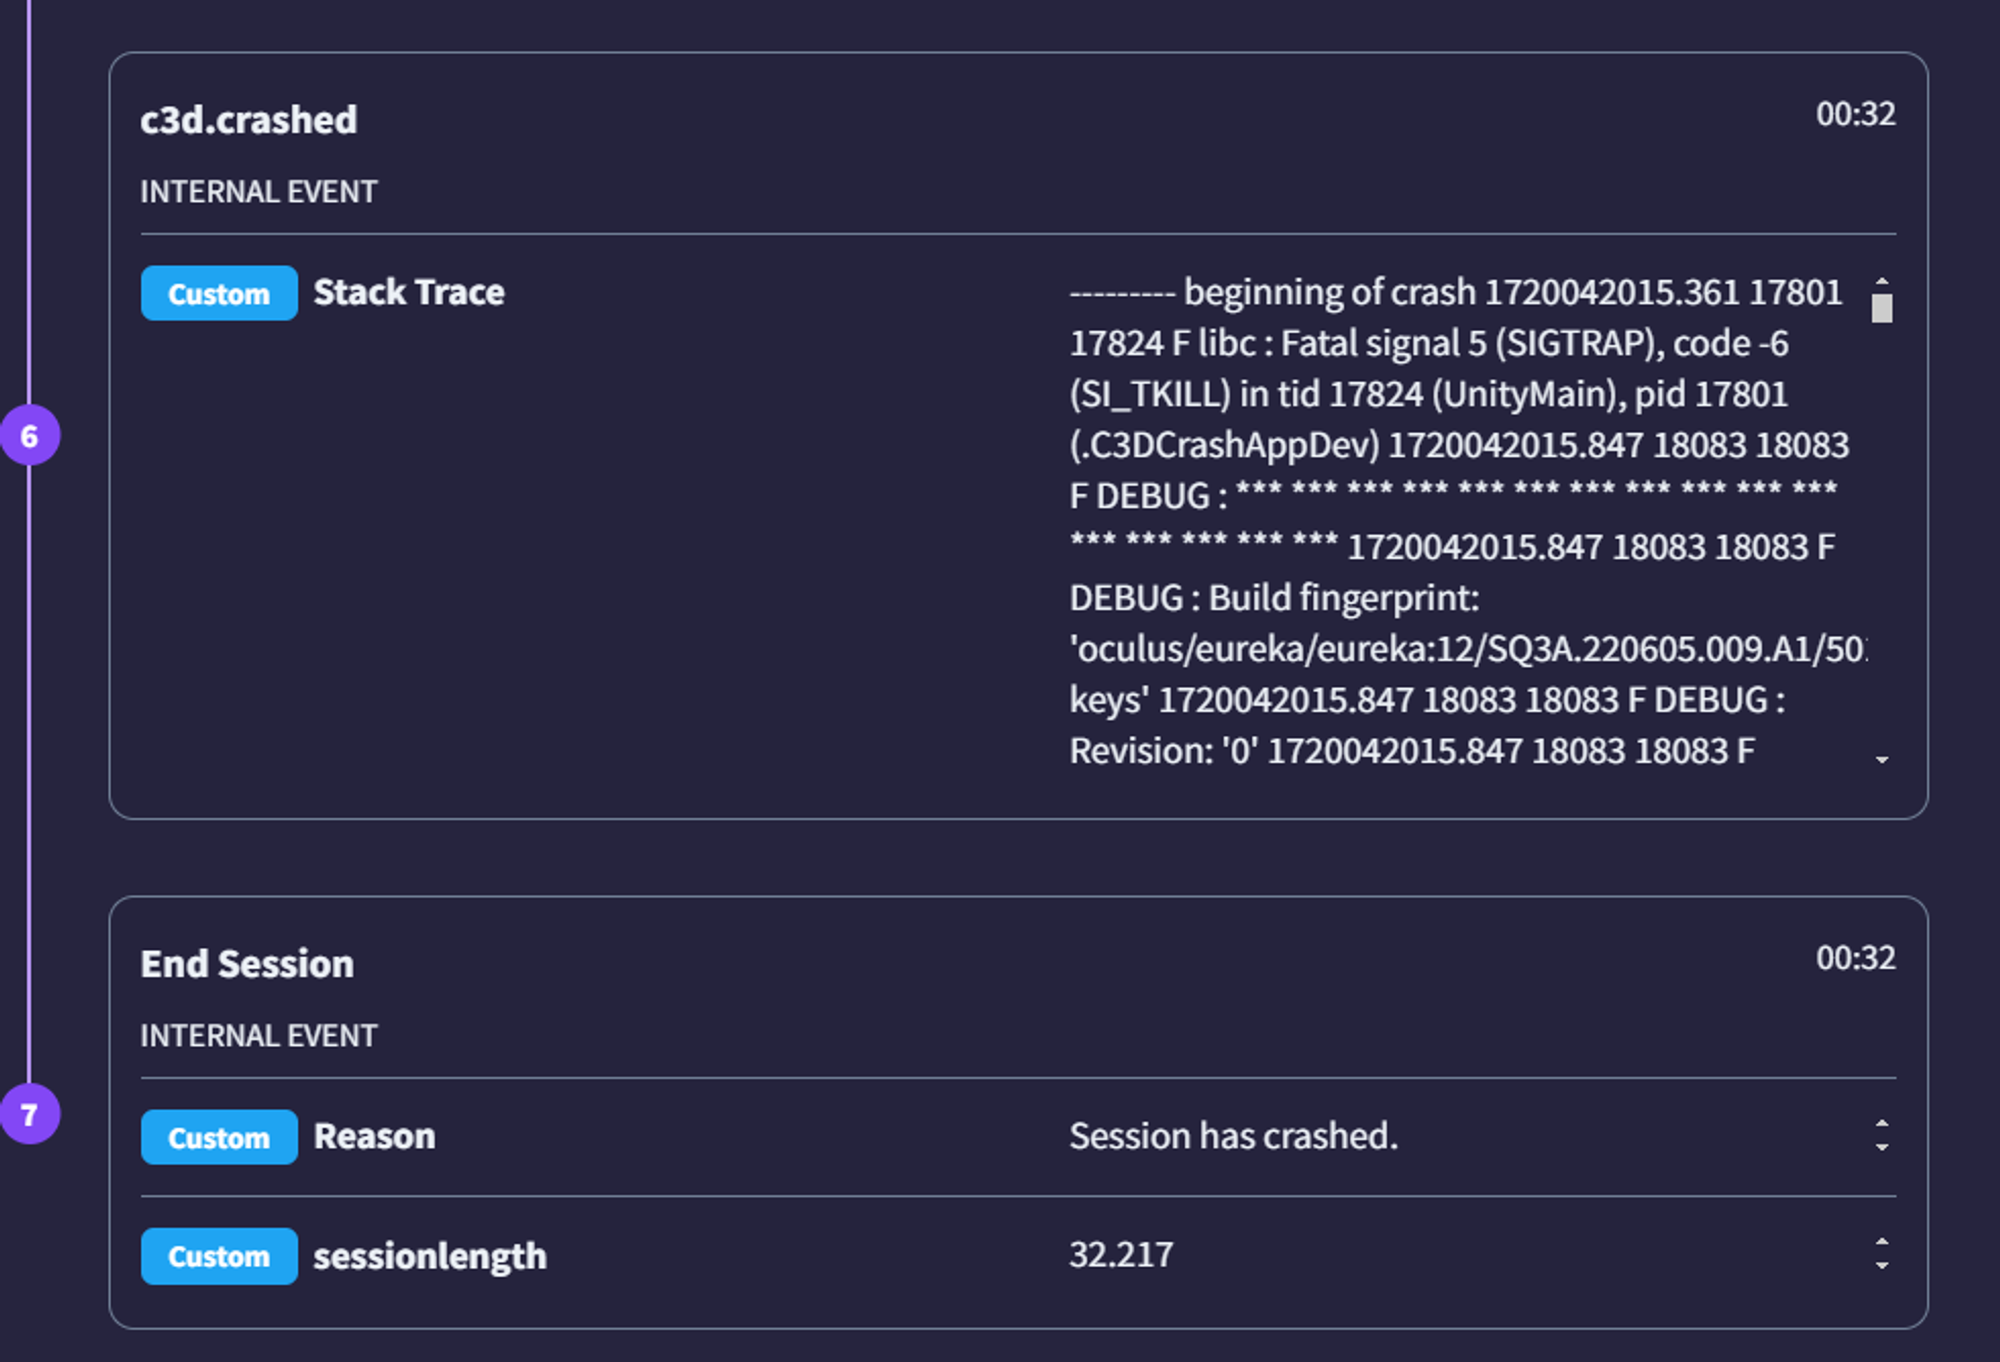
- Crash Log Monitoring: The plugin automatically detects and logs crash events, capturing detailed stack traces and contextual information to help pinpoint the exact cause of crashes. These sessions are tagged as “Crash” on the Cognitive3D dashboard for our customers.

-
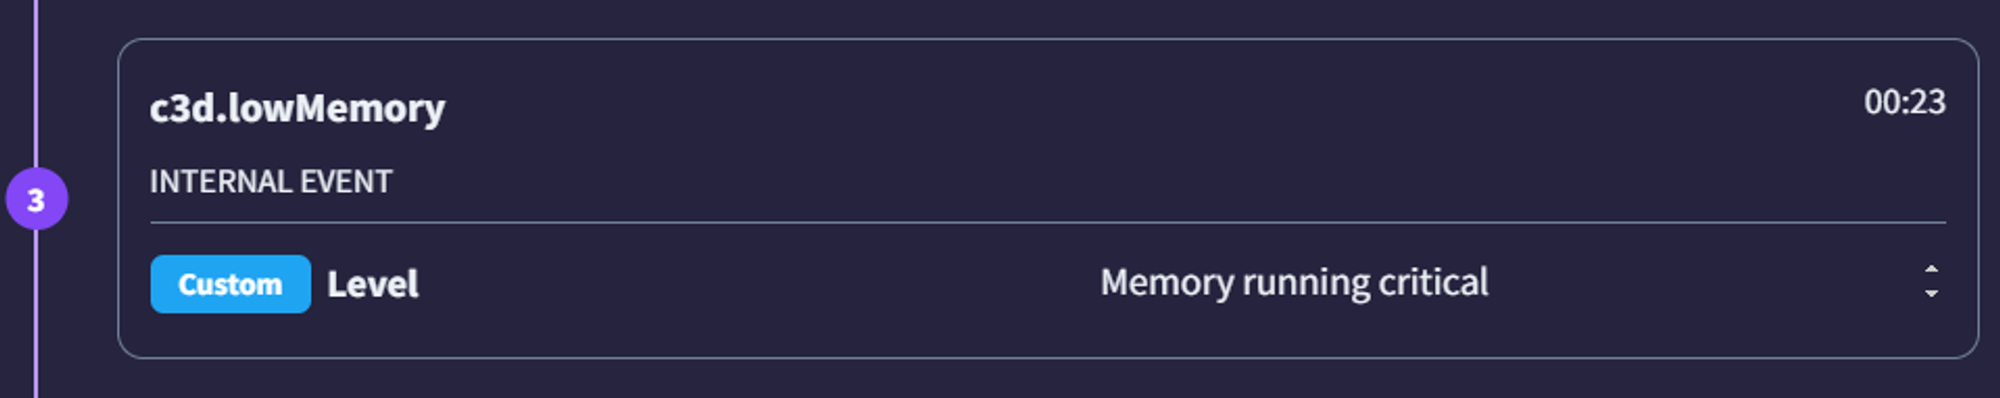
Low Memory Log Monitoring: Low memory conditions can cause app slowdowns, crashes, and other issues. Our plugin monitors these events and logs relevant details, allowing developers to take proactive measures to optimize memory usage. These sessions are tagged as “LowMemory.

-
Crash and Low Memory Events: Access comprehensive details and analytics that provide deep insights into log data. These crash and low memory log events are sent and displayed within the session timeline on the Cognitive3D session details page, guiding your debugging and optimization efforts. This shows an example of the depth of the crash log accessible in a session details page on our dashboard.
How to Get Started
To incorporate our plugin into your Unity project, follow these simple steps:
- Download the Unity SDK: Access the plugin by downloading the latest SDK version (1.5.2) from our official repository here.
- Set up and Integrate the SDK with Your Project: Follow the provided documentation to set up and integrate the SDK with your Unity project.
- Add the Cognitive3D_Manager Prefab to Your Scene: Ensure that the Cognitive3D_Manager prefab is present in your scene to utilize the plugin's features effectively.
- Deploy and Monitor: Deploy your app with the integrated SDK and start monitoring log events on the Cognitive3D dashboard. To isolate sessions that crashed or had low memory issues you can filter using session tags on the dashboard.
For more details about the plugin, please visit our documentation page.
Unreal Engine support
Support for External Log Monitoring for applications built with Unreal Engine is coming soon. Let us know if this is a priority for you.